PERT: What is it?
PERT is an acronym for Program Evaluation & Review Technique, and was developed by United States Defence as a quick estimating strategy in 1950’s. It is also known as Three-Point technique or PERT Weighted Average. PERT can be used to apply to Costs, and Schedules.
Understanding the PERT Estimation
PERT emphasis on Three-Point estimate for each Project activity incorporating Optimistic(O), Pessimistic (P), and Most Likely (M) time estimates.
The Formula to Calculate Expected Duration (TE) for an activity is
TE = O+4M+P
6
This formula considers a weighted average, giving more weight to the most likely estimate. The resulting Expected Duration provides a more realistic view of the time required for an activity, considering both optimistic and pessimistic scenarios.
Key Components of PERT Estimation
Optimistic estimates (O):
The best-case scenario estimate, representing the minimum time required to complete an activity without any risks and favorable situation.
Pessimistic Estimate (P):
The worst-case scenario estimate, indicating the maximum time needed for activity completion Including Risks and an unfavorable situation.
Most Likely Time (M):
The most realistic and probable time estimate based on historical data and expert judgment, including favorable & unfavorable situations.
Let’s look at an example below.
| Sl..no.. | Activities | Optimistic time(O)
In Days |
Most likely time (M)
In Days |
Pessimistic time (P)
In Days |
Expected Duration
TE = (O+4M+P)/6 In Days |
| 1 | Requirement Analysis | 10 | 15 | 20 | 15 |
| 2 | Development | 20 | 30 | 40 | 30 |
| 3 | SIT/Functional Testing | 12 | 18 | 23 | 18 |
| 4 | UAT Testing & Support | 10 | 15 | 22 | 15 |
| 5 | Production Deployment | 4 | 6 | 10 | 6 |
| 6 | Hypercare/Warranty Period | 10 | 15 | 23 | 16 |
| Total TE Project | 100 | ||||
Table 1
Note: The above Activities can be broken down into smaller tasks. I have taken an Abstract of Activities for Illustration only.
Let’s Assume the Project Start Date as 06-Dec-2023
| Sl..no.. | Activities | TE | Start Date | End Date |
| 1 | Requirement Analysis | 15 | 06-Dec-2023 | 21-Dec-2023 |
| 2 | Development | 30 | 21-Dec-2023 | 20-Jan-2024 |
| 3 | SIT/Functional Testing | 18 | 20-Jan-2024 | 06-Feb-2024 |
| 4 | UAT Testing & Support | 15 | 06-Feb-2024 | 22-Feb-2024 |
| 5 | Production Deployment | 6 | 22-Feb-2024 | 28-Feb-2024 |
| 6 | Hypercare/Warranty Period | 16 | 28-Feb-2024 | 15-Mar-2024 |
Table 2
Note: Some of the above dates fall on Weekends, and this is just for Illustration Only
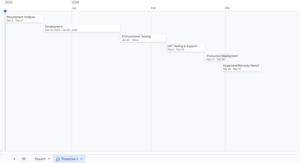
Now, let’s build a Timeline Chart using Table 2.
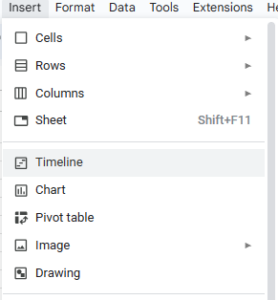
To Create the Timeline Chart in Google Sheets
- Select the above Table 2 (Data Range i.e Sheet1!C16:G22) in the example (Attached Google Sheet Below for Reference)
- Click on Insert → Select & Click on Timeline
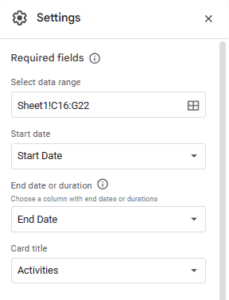
- Map the Column from Table 2 on Required fields (Settings) on the left pane to the following
- Start Date -> Start Date
- End Date or Duration -> End Date
- Card Title -> Activities
Timeline Chart in Google Sheet
Link to the spreadsheet: PERT Estimation_Example
Benefits of PERT Estimation
- Probability Analysis: PERT estimation embraces a probabilistic methodology, offering a spectrum of potential durations for each activity. This contributes to the assessment and management of risks within the project.
- Improved Accuracy: PERT estimation provides a more detailed and precise depiction of project timelines when contrasted with conventional single-point estimates.
- Effective Resources Allocation: Project managers can better allocate resources by understanding the variability in activity durations. This promotes optimal resource utilization.
- Risk Mitigation: PERT estimation highlights critical path activities and potential bottlenecks, allowing project teams to focus on risk mitigation strategies.
By embracing the three-point/PERT estimation methodology, Project Managers/Sales/Developers/Testers can navigate uncertainties, enhance decision-making, and steer their teams toward successful project completion. PERT estimation is not merely a mathematical tool; it’s a strategic ally in the pursuit of project success, offering a holistic view that empowers teams to adapt, innovate, and thrive in the face of complexity.

