
When it comes to Business reporting or doing Enterprise Planning for Actuals vs. Budget, Forecasting is often done to make informed decisions about the future, budget allocation, projects/resources planning, and identify potential risks and opportunities.
SAP Analytics Cloud offers a multitude of ways to achieve this, which are chiefly:
- In-Built Time-series Forecasting within SAC Stories/Designer Application
- Using Predictive Scenarios, also known as Smart Predict, on top of Planning Models (Note: Smart Predict may not be available in certain regions/tenants, also not available on tenants provisioned on top of the BTP Neo environment
There is a third approach that we will cover in this blog, which is Using R with SAP Analytics Cloud.
Use Case: Forecasting monthly sales.
Assumptions: Historical Data from Jan 2017 to Dec 2018, Monthly Sales projection from 2019 onwards. Actual & budget set for FY 2017 & 2018. The budget is allocated after achieving the point forecast/range.
For this Use Case, the Corporation has Sales figures in the range of Jan 2017 to Dec 2018, and to efficiently set the budgeting for future months/years, they need an accurate forecast.
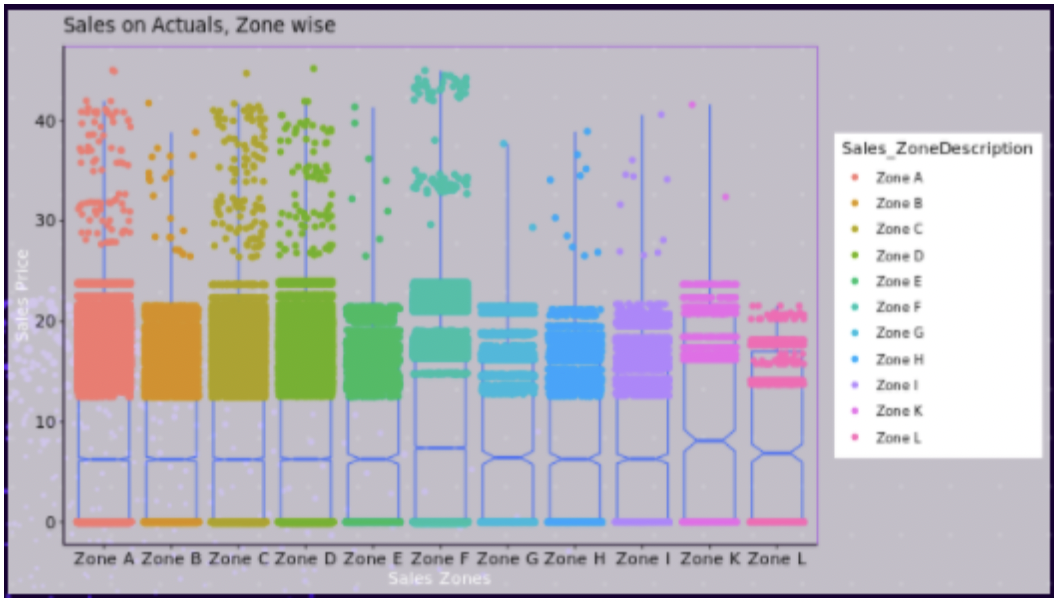
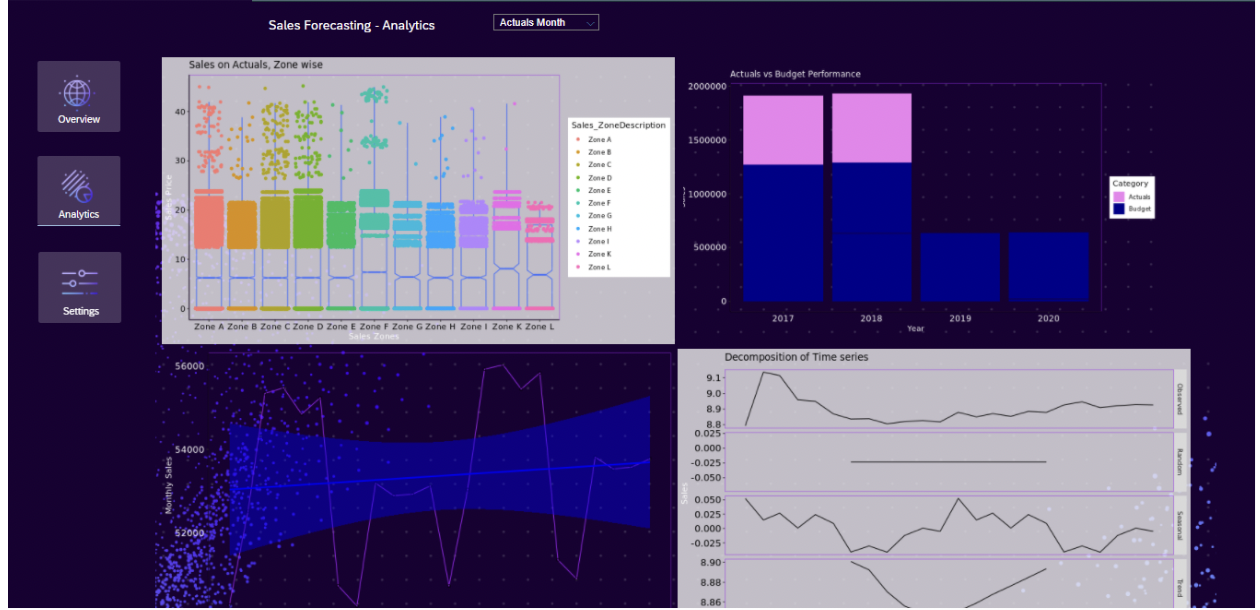
We start with Basic Exploratory Data Analysis using Box-Plots or targeted visualizations unsupported by Standard SAC Widgets.
First, we have the Zone-wise Sales based on Actuals providing insights on the distribution & spread of sales, making it possible to check for outliers and take corrective actions before moving to forecasting. Here we see that for most of the zones, the Sales are generally between 12 to 23 based on day-wise sales figures.
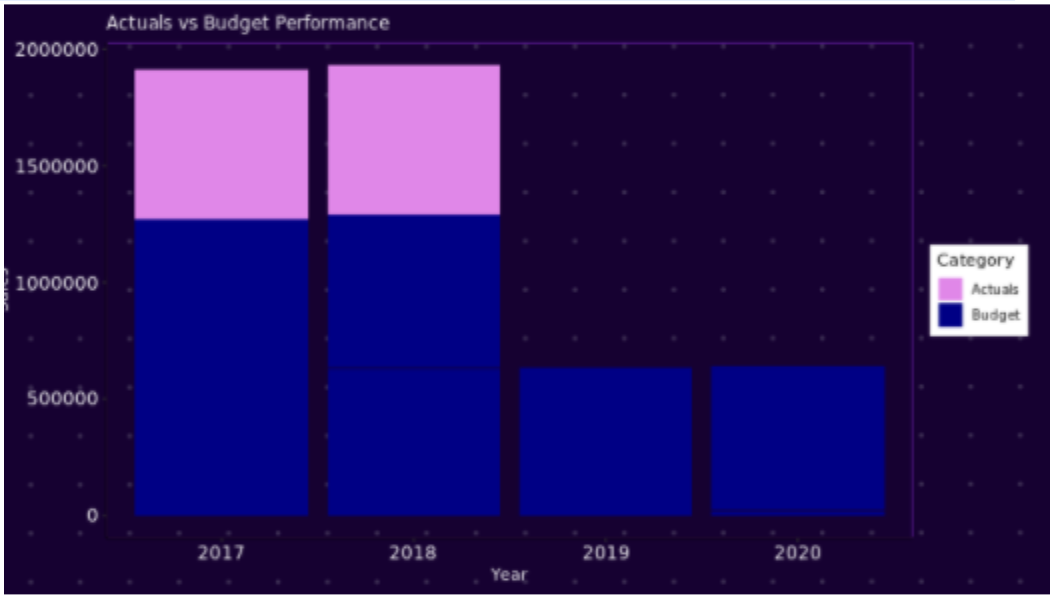
We create the infographics to Check Actual vs. Budget Quarterly Performance.
Steps towards Forecasting
First, we plot our Monthly sales data against Year-Month for Actuals data.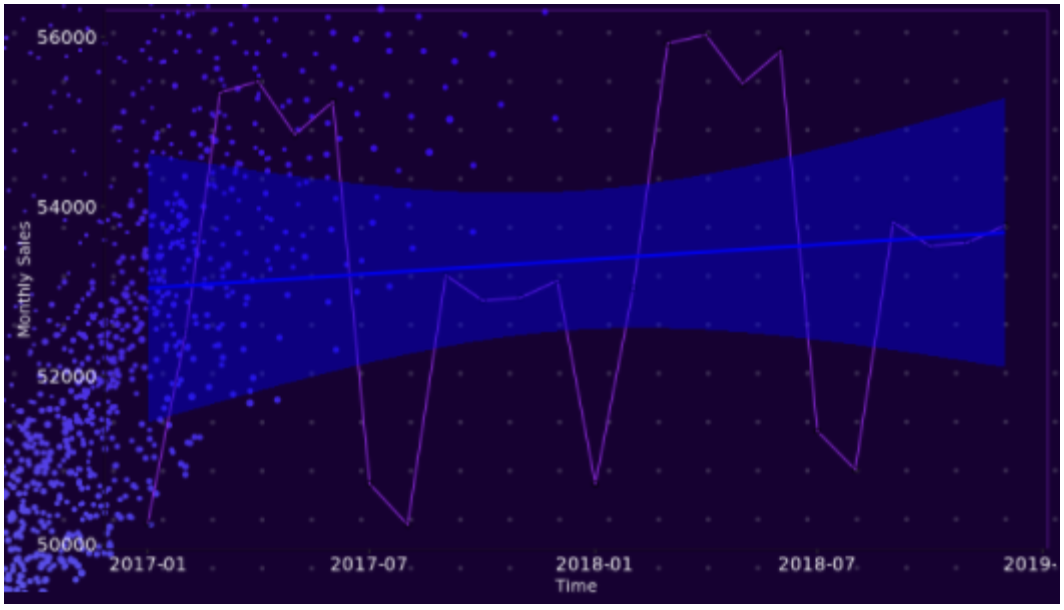
Looking at the plot below, the monthly aggregate sales are highly seasonal, with higher sales in H1, preceded by a slight slump in sales in the later part of the year. We can uncover the underlying trend and the seasonality using decompose.
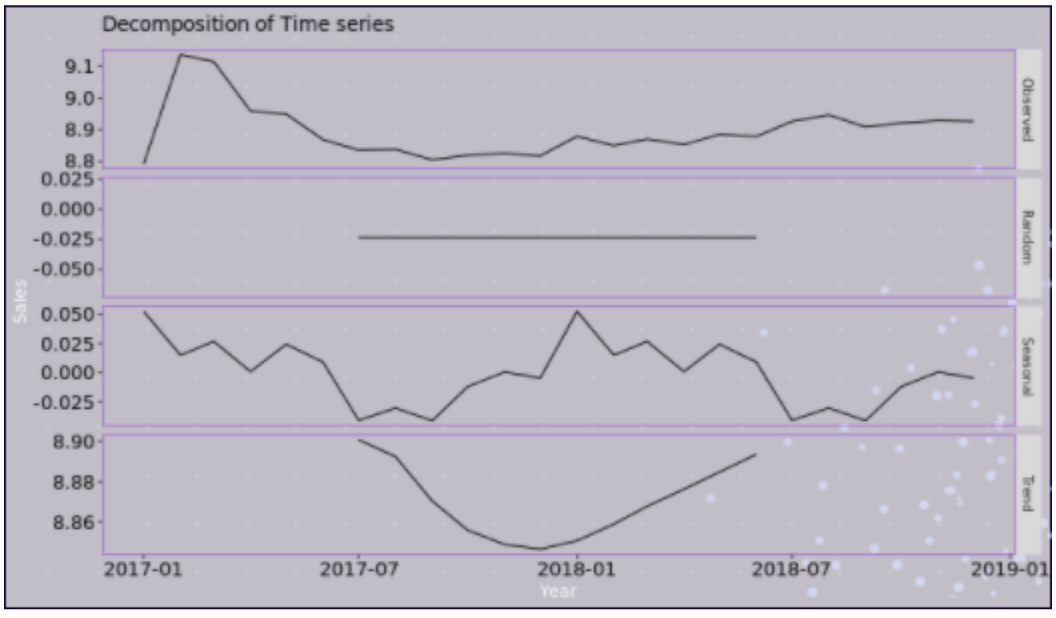
Looking at the decomposition plot, we can see a significant stable downward trend over the last year for observed values, and we can see the regular, seasonal component of our data.
Based on these insights, we can attempt to build a forecast model using the Triple exponential smoothing method (also known as Holt-Winters exponential smoothing).
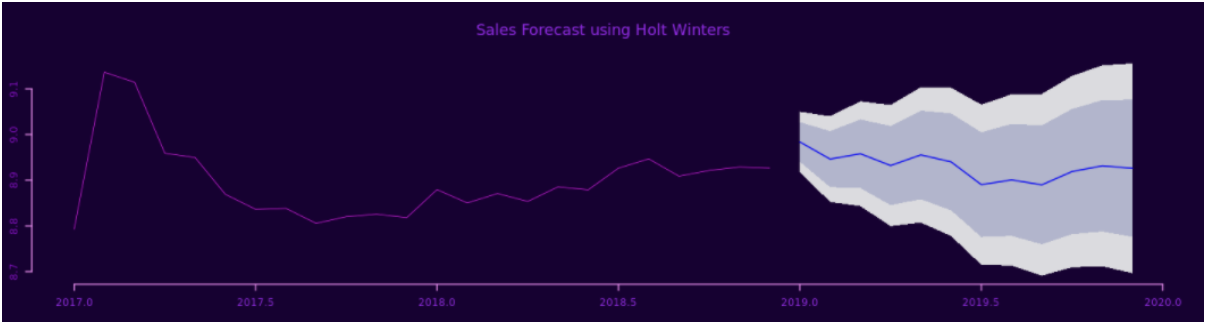
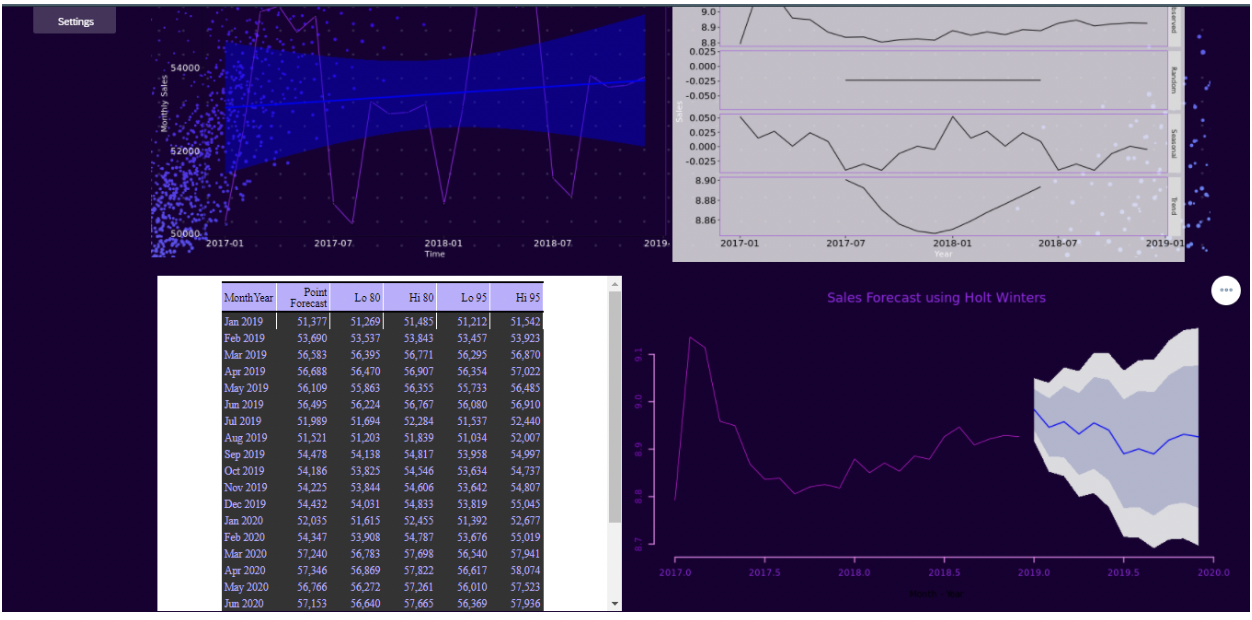
Looking at the output, we can see that we have our monthly forecast and the pattern Sales figures in 80% and 95% confidence intervals.
We have used Triple exponential smoothing to forecast the sales revenue for the next 24 months. From this point, we can do several tests to check our model and see if we can improve it, including fitting different models (ARIMA, ETS), training & validating the best algorithm for the forecasting.
Final Dashboard
Code Samples/Dumps:
https://github.com/MindsetConsulting/sac-r-fcast-blg.git
View our LinkedIn, here.