
Business IT departments often face a dilemma in deciding on a solution of choice for reporting or analytics dashboard for its stakeholders, including looking for prospective resource engagement, vendors, and overall sustainability and TCOs.
Let’s assume the customer has already invested in SAP ERP or S/4 HANA (on-premise) or S/4 HANA (Cloud) for end-to-end business, i.e. Transactional and Reporting (Warehouse) Data held over SAP HANA largely.
The question then is, what solutions are available within the SAP portfolio of services that can deliver on a complete customer experience dashboard. The options here are;
- Firstly, SAP S/4 HANA with Embedded Analytics, and Analytics Apps (Standard as well as scope for Custom)
- Secondly, SAP Analytics Cloud (Additional license required)
- Finally, SAP BTP Big Data Services, SAP Data Warehouse Cloud, SAP Data Intelligence (If additional data sources need to be connected, involvement ETL or additional requirement for streaming analytics, event processing, etc.)
Finally, compare this to the requirement of setting up dashboards on the below endpoints:
- Microsoft Power BI
- AWS Quicksight
- Tableau
- Qlik View/Qlik Sense
Note that most of the above-listed visualization tools have evolved from the earlier self-service Data analysis interface for flat excel-like data sets/sources to the Insight-based visualization for the enumerable data sources, extending to the SAP ecosystem by allowing integration with Cloud infrastructure and connectors, allowing for infinite reporting possibilities.
Additional overheads or op-ex on cloud infrastructure are associated with Visualization tools. Along with the involvement of multiple cloud components on private tier/tenant.
Sample architecture of such a landscape (Azure).

Here, you can note the involvement of multiple moving parts. Manual Monitoring of Data pipelines is required till the whole data flow is stabilized and appropriate validations and governance are in place. Involvement of a larger set of technical experts like Data Engineers, along with Business Analysts, Data Analysts/Scientists who have to work along with backend or ERP engineers/consultants is a requirement at all stages. This is true from realization to execution and support.
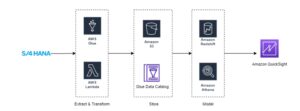
Sample architecture (AWS).
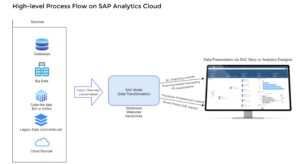
High-level Process Flow on SAP Analytics Cloud
Considerations at this point;
1. Do you have a future roadmap of eventually requiring to make entire business and operational analytics as a 360-degree cockpit to your stakeholders?
Choose a go-to cloud approach with any of the visualization tools. With associated incremental or ongoing subscription-like costs.
2. Do you only require specific business entities to closely track and measure within just a few months of investment/IT delivery?
Choose out-of-the-box delivered tools and services from within the SAP ecosystem. S/4HANA-based Embedded Analytics Dashboard often achieves this in a short span of time.
3. Do you require flexibility or heavy customizations of Visual/UI/Charts-like Elements to suit your business?
A UX-centered Custom Development on S/4 HANA with or without BTP or Cloud is suitable, given that visualization tools like PowerBI, and Tableau are not very agile to provide for custom UI elements or widgets. However, better options are available via UI5, and other web components
- For the dashboards, do you intend to connect or mash-up SAP data with data from various sources, including Big Data or non-SAP sources? Depending upon the feasibility of Big Data storage or existing Data Lake investment, you can choose your preferred visualization tool.
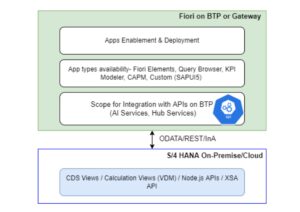
Design of SAP Fiori-based Analytical Applications at a high-level
Note:
Doing Analytics over SAP data via Cloud-based replication (AWS/Azure) requires the creation of Data pipelines. It can also require additional processing, transformation and loading of data, and building of scripts and queries for dashboard consumption. Subsequently, the dimension and measures over which the KPI dashboards are to be realized are often available directly over S/4HANA Embedded Analytics Apps or Fiori Analytical Apps. This is easy to overlook. However, even scenarios that may not be directly available would require less time for realization and execution without involving multiple products, cloud services, or cloud infrastructure. In conclusion, make sure you have fully utilized your existing investment before jumping to a full-fledge Cloud-based Visualization tool. S/4HANA packs enough punch, but it often goes unrecognized or unexplored!
Learn more about our journey on LinkedIn.
View our resources page, here.


