In continuation of my previous blog, today, I will discuss ‘How to create an Analytical List Page using SAP Fiori -> ALP template and CDS views/annotations. The CDS views/annotation and the Fiori app are created in HANA Studio and Business Application Studio, respectively.
What is the Fiori Element Analytical List Page?
The ‘Analytical List Page’ is a unique template for visualizing transactional data with analytical charts. It is one of the powerful templates from which we can create an analytical dashboard with the help of graphs, KPIs, filters, visual filters, etc. Additionally, we can create an Object Page using this template.
The Analytical Page has 3 sections:
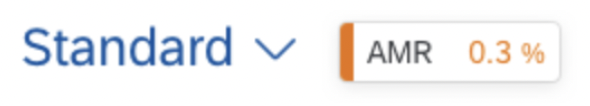
1.Title: Page Title contains Variant Management and KPI Tags.
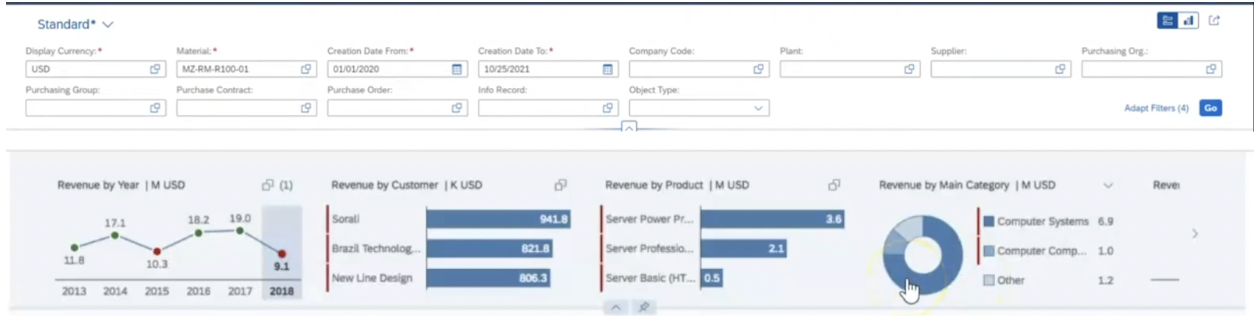
2. Header: Page Header contains Compact Filters and Visual Filters along with adapt filters and Go button.
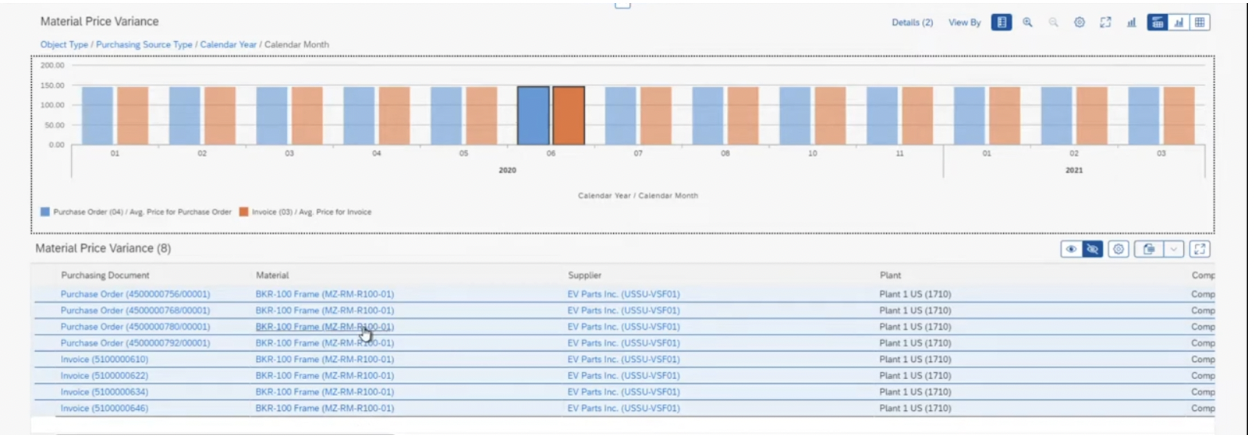
3. Content: Page Content contains Charts and Table (different kinds of views are available)
Let’s continue with the steps to create the ‘Analytical List Page.’
Creating CDS Views:
Prerequisite: Go through my previous blog for HANA Studio configurations; we also need SAP Business Application Studio; now, we are ready to create CDS views and ALP Fiori App.
1. Open HANA Studio > Logon to your S4 System > Right-click on $TMP package > New > Select Other ABAP Repository.
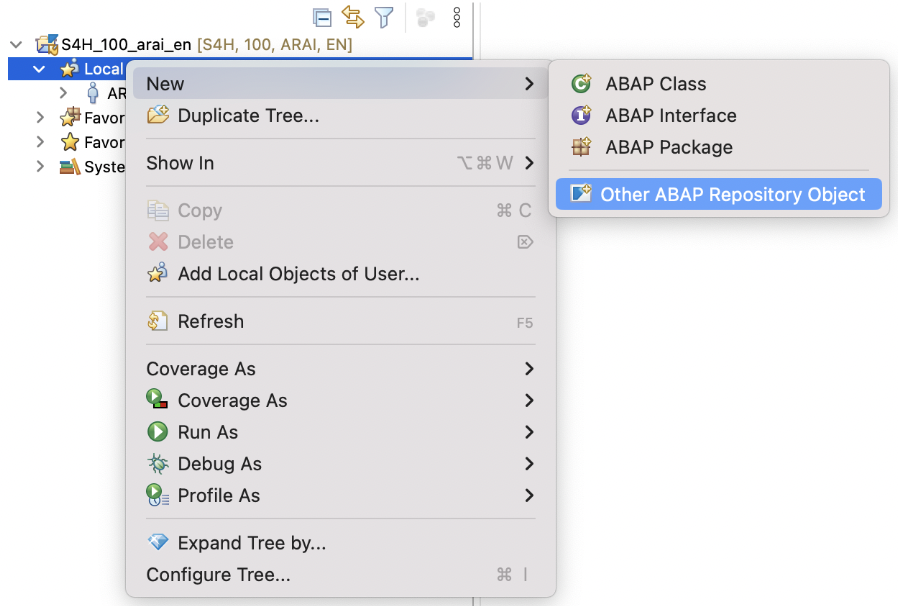
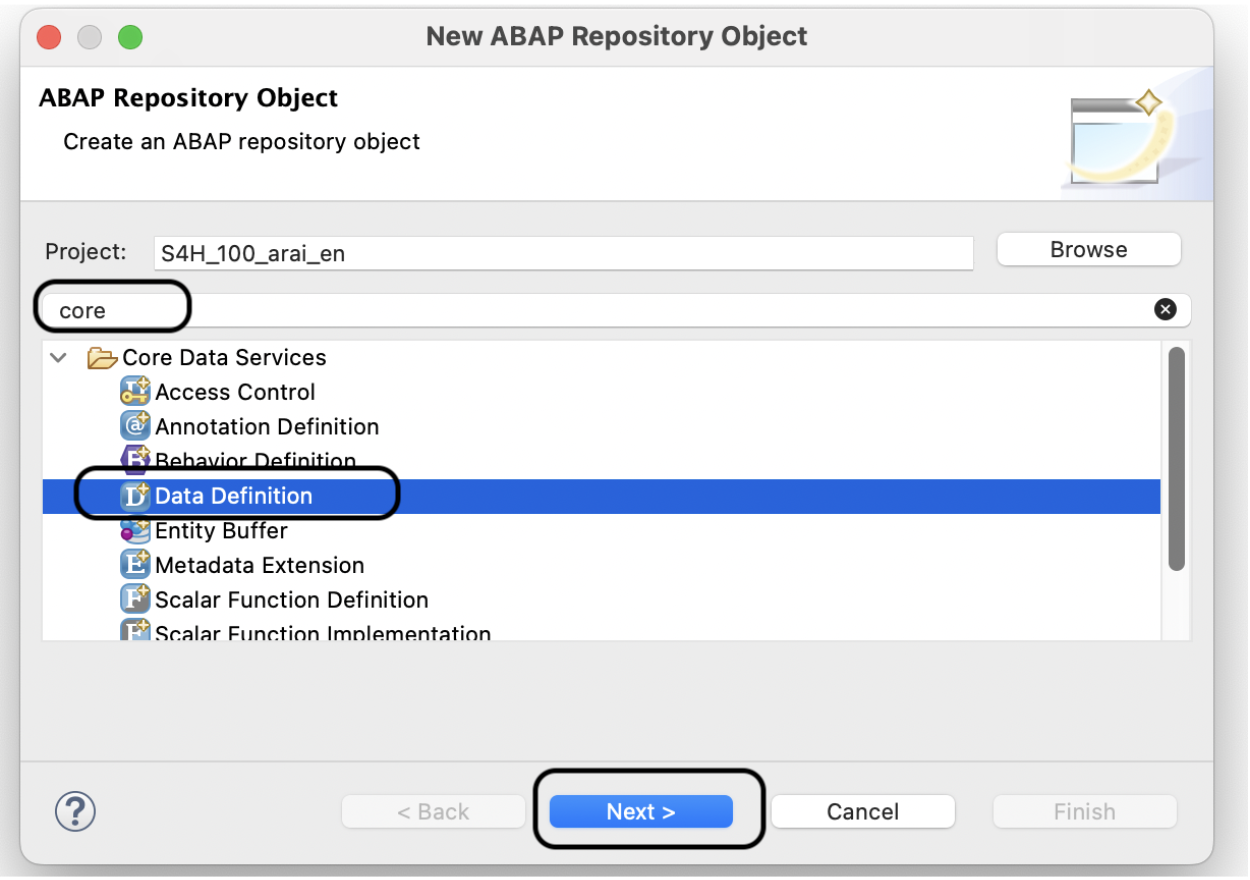
2. Select ‘Data Definition’ under ‘Core Data Services and click on Next.’
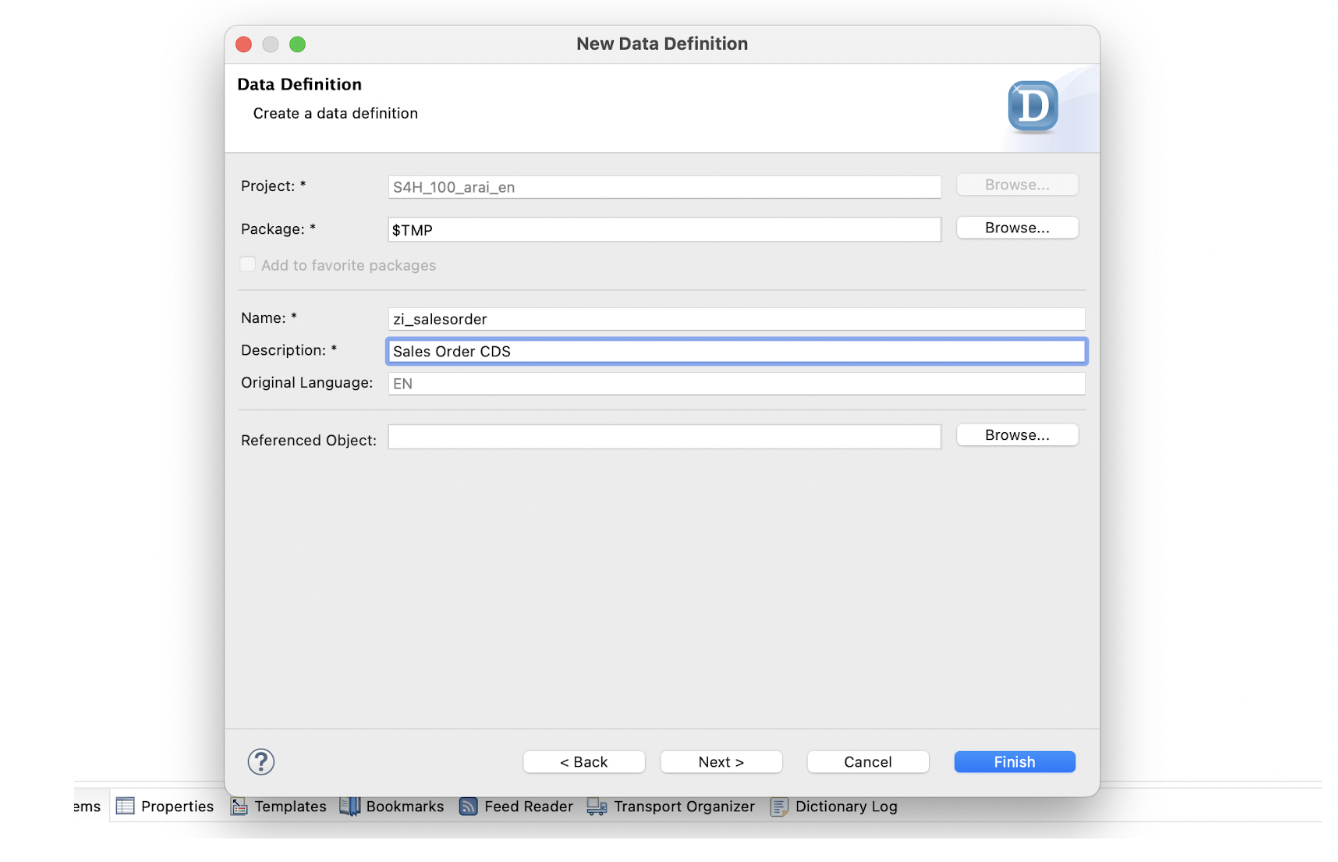
3. Provide ‘Name’ and ‘Description’ and click on Next.
4. Select ‘Define View’ and select ‘Finish’.
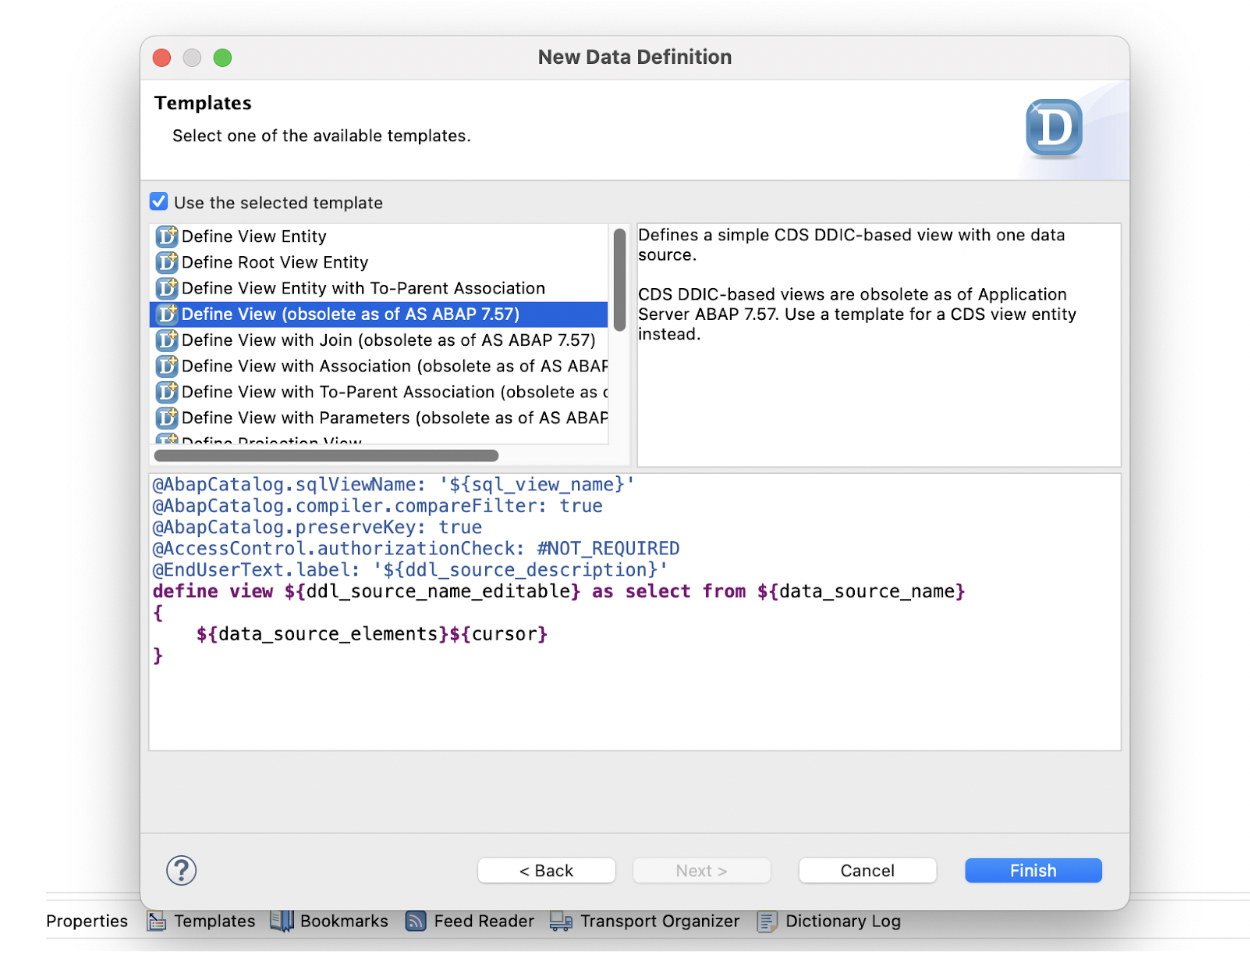
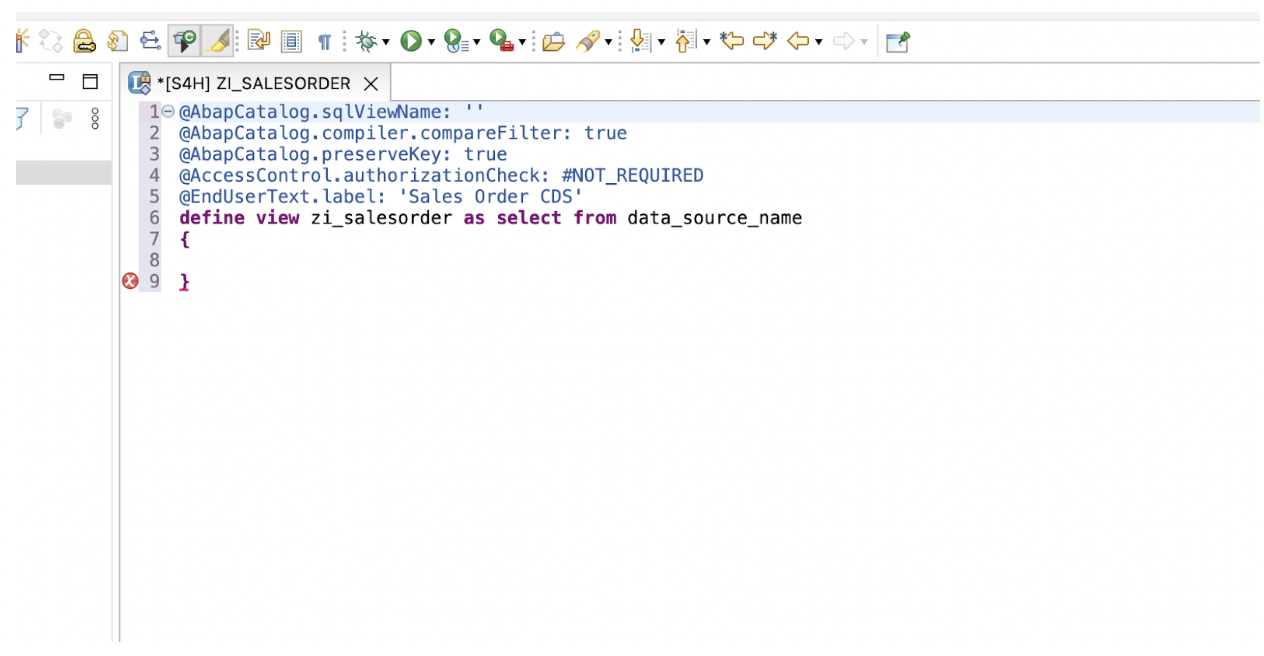
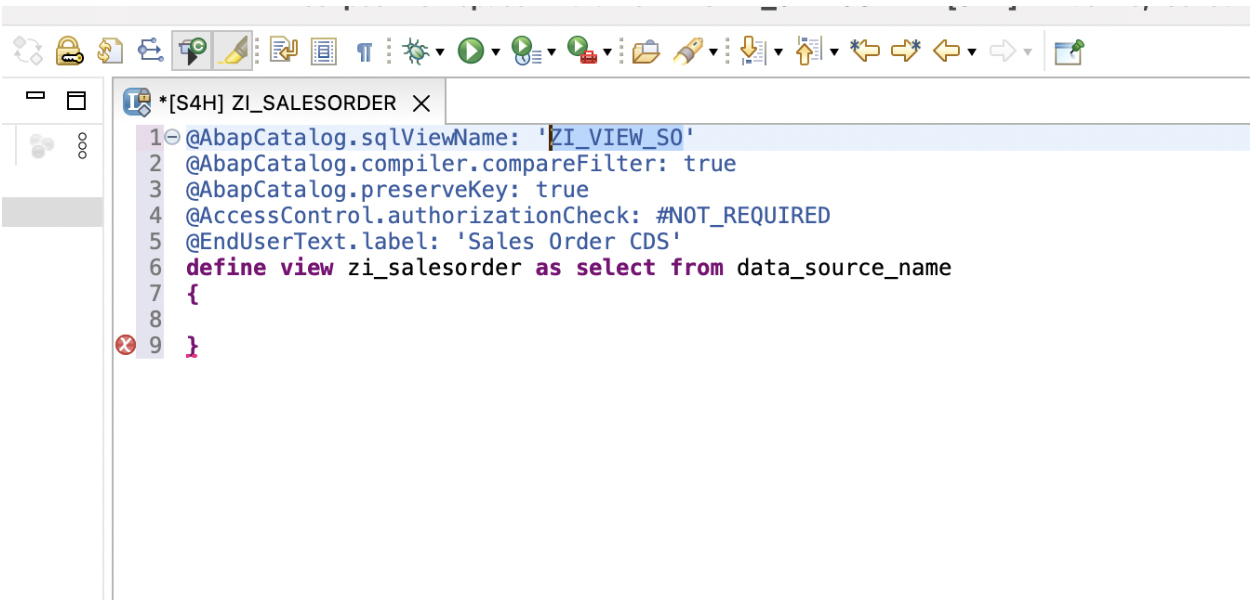
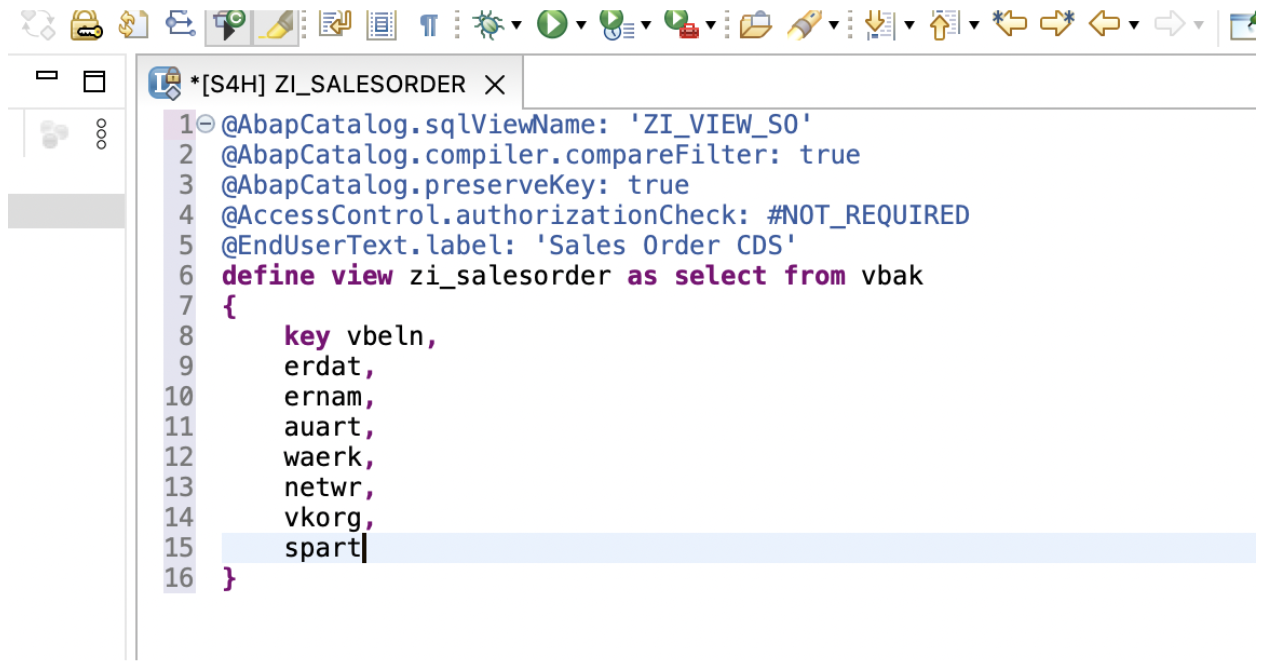
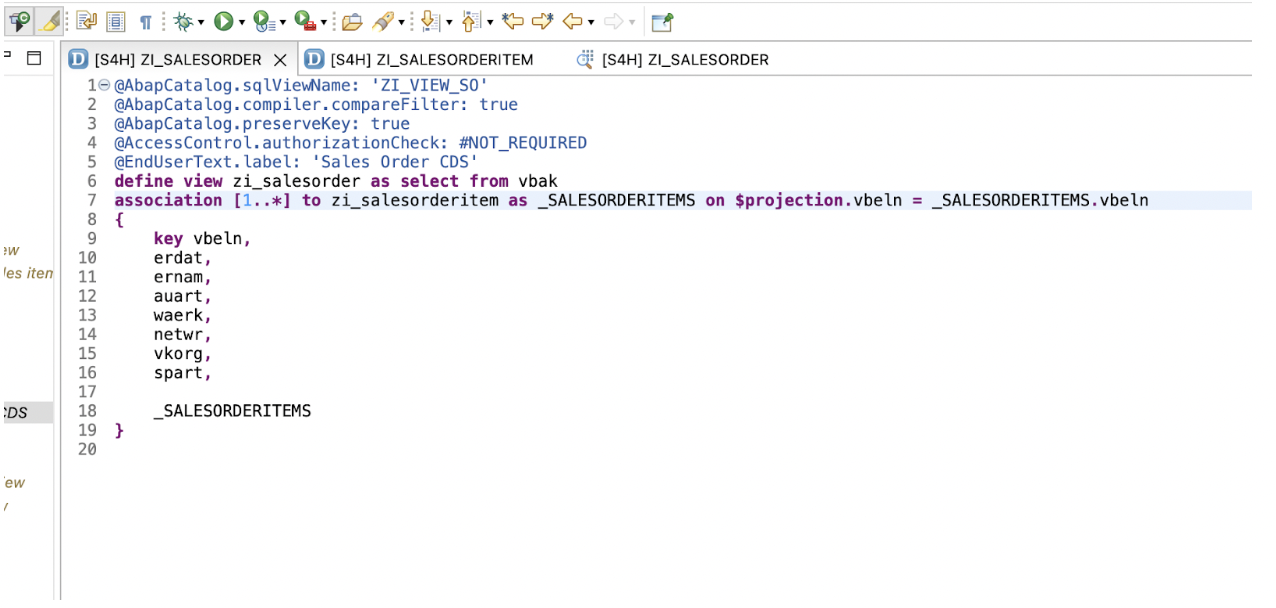
5. Below is the basic CDS structure. We will add the SQL View name in the first line and add some elements along with the data source—press cmd+S to save the CDS view.
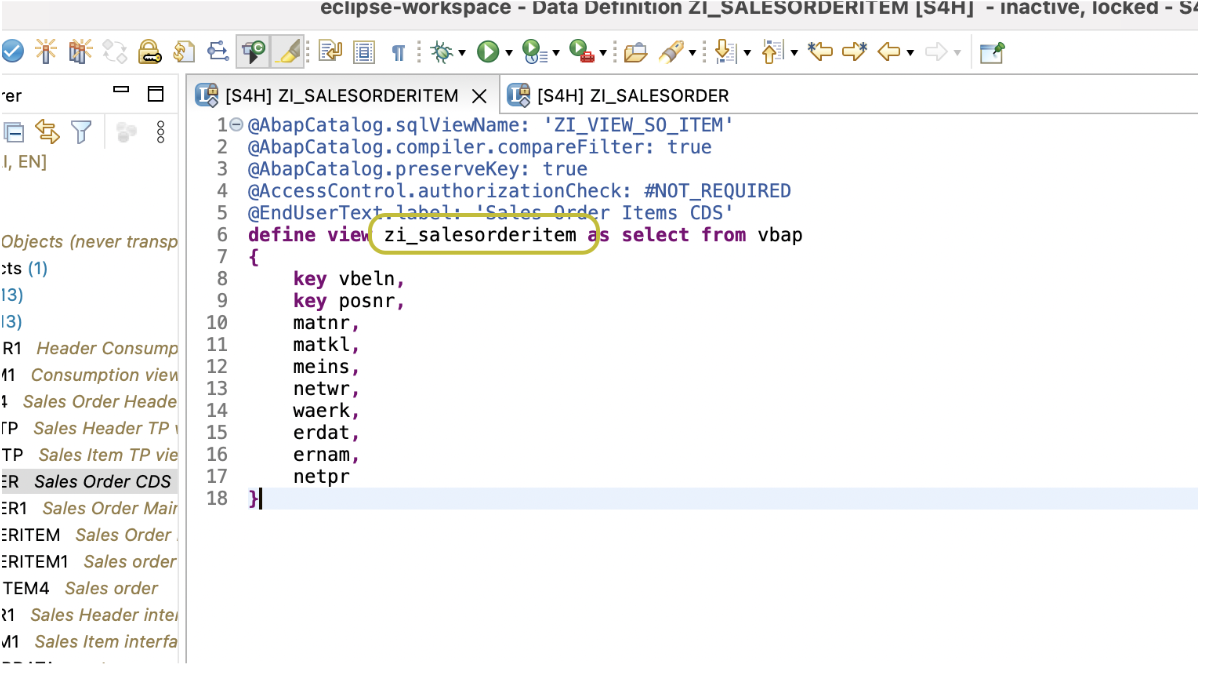
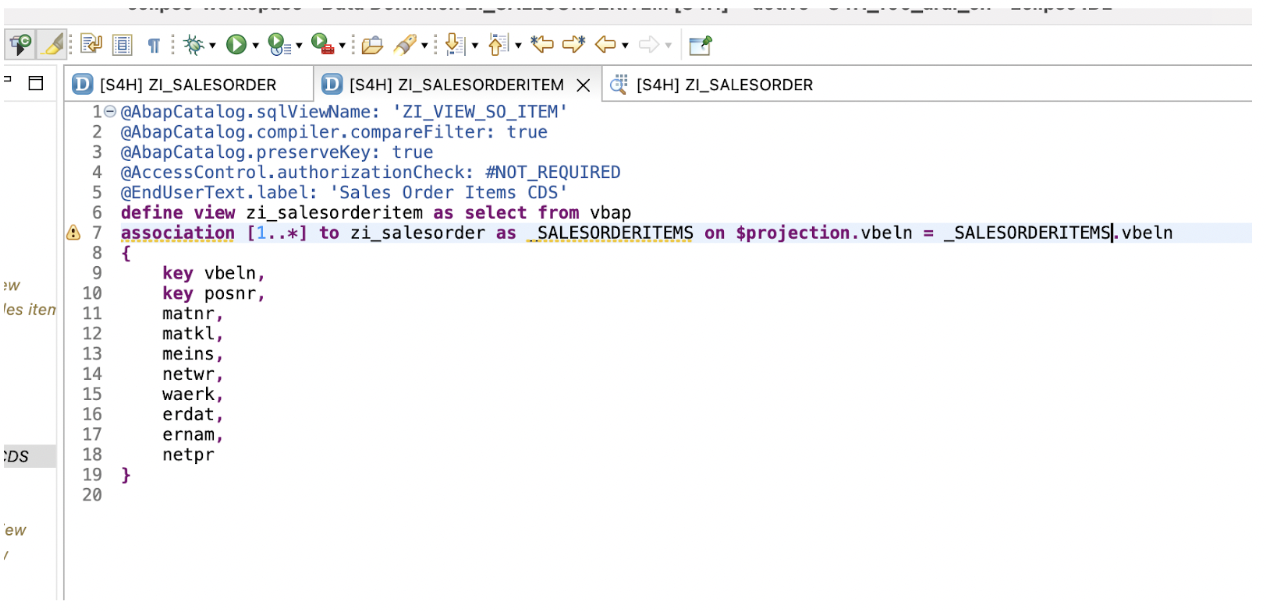
6. Create another CDS view in a similar manner.
7. Now, create an association between these two CDS views to read related data of the Sales Order Items CDS view from the Sales Order CDS View. This will help drill down to Object Page navigation from the Main Page. Additionally, we will add the below lines in respective CDS views, save, and Activate both together.
8. The association is created between both the CDS views. Now we will right-click on the created Data definitions and run it as an ABAP project. Further, this is the Data Preview.
Exposing CDS View as an OData Service:
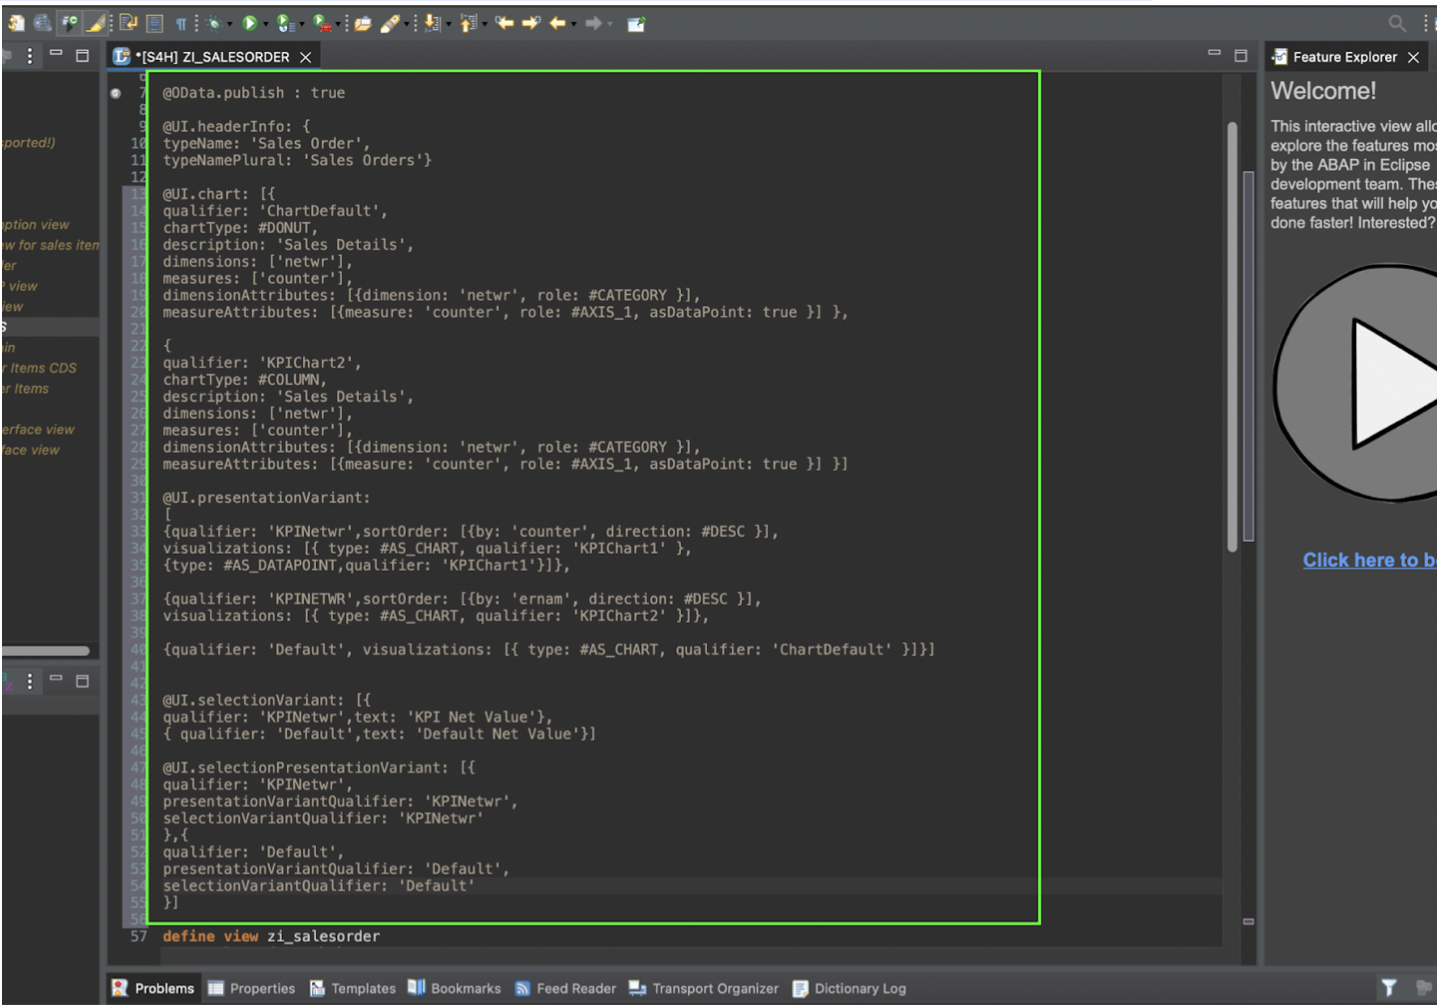
1. Open ‘ZI_SALESORDER’ CDS view and add ‘@OData.publish : true’ define view as below:
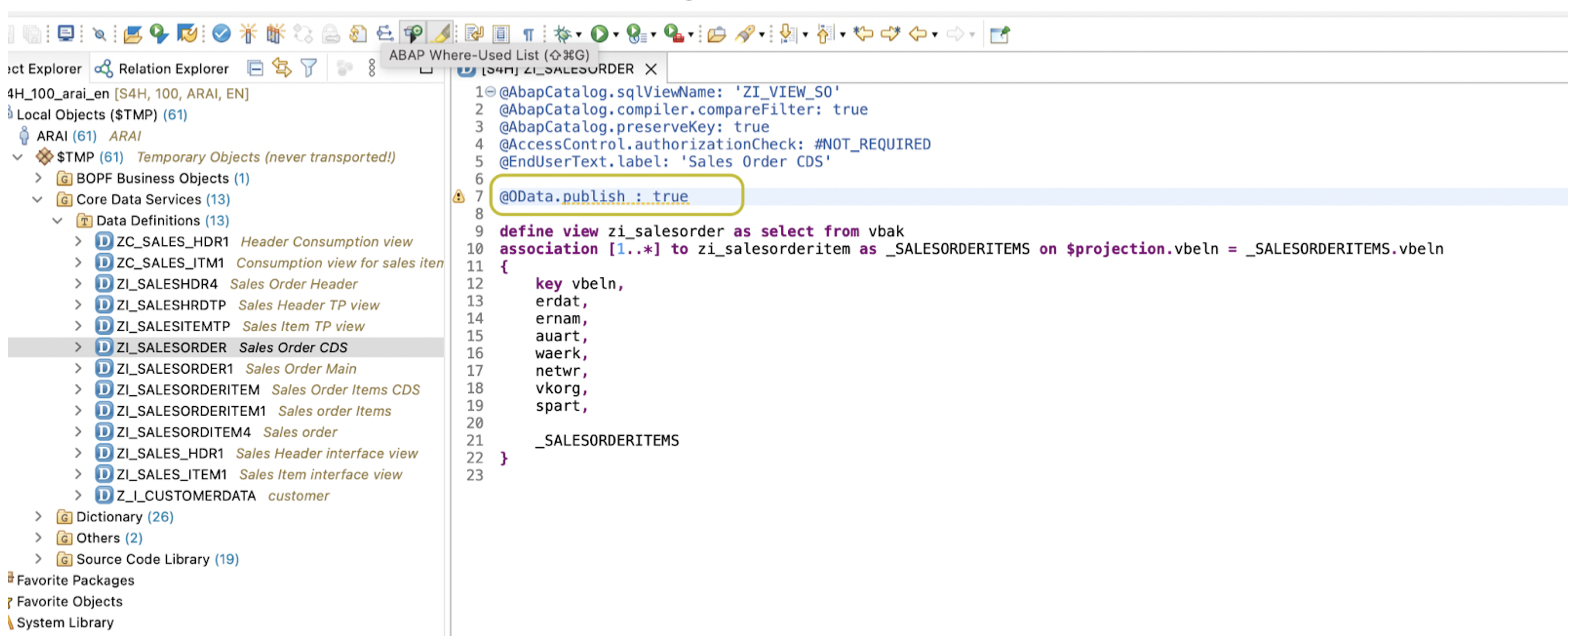
2. Save and activate the view.
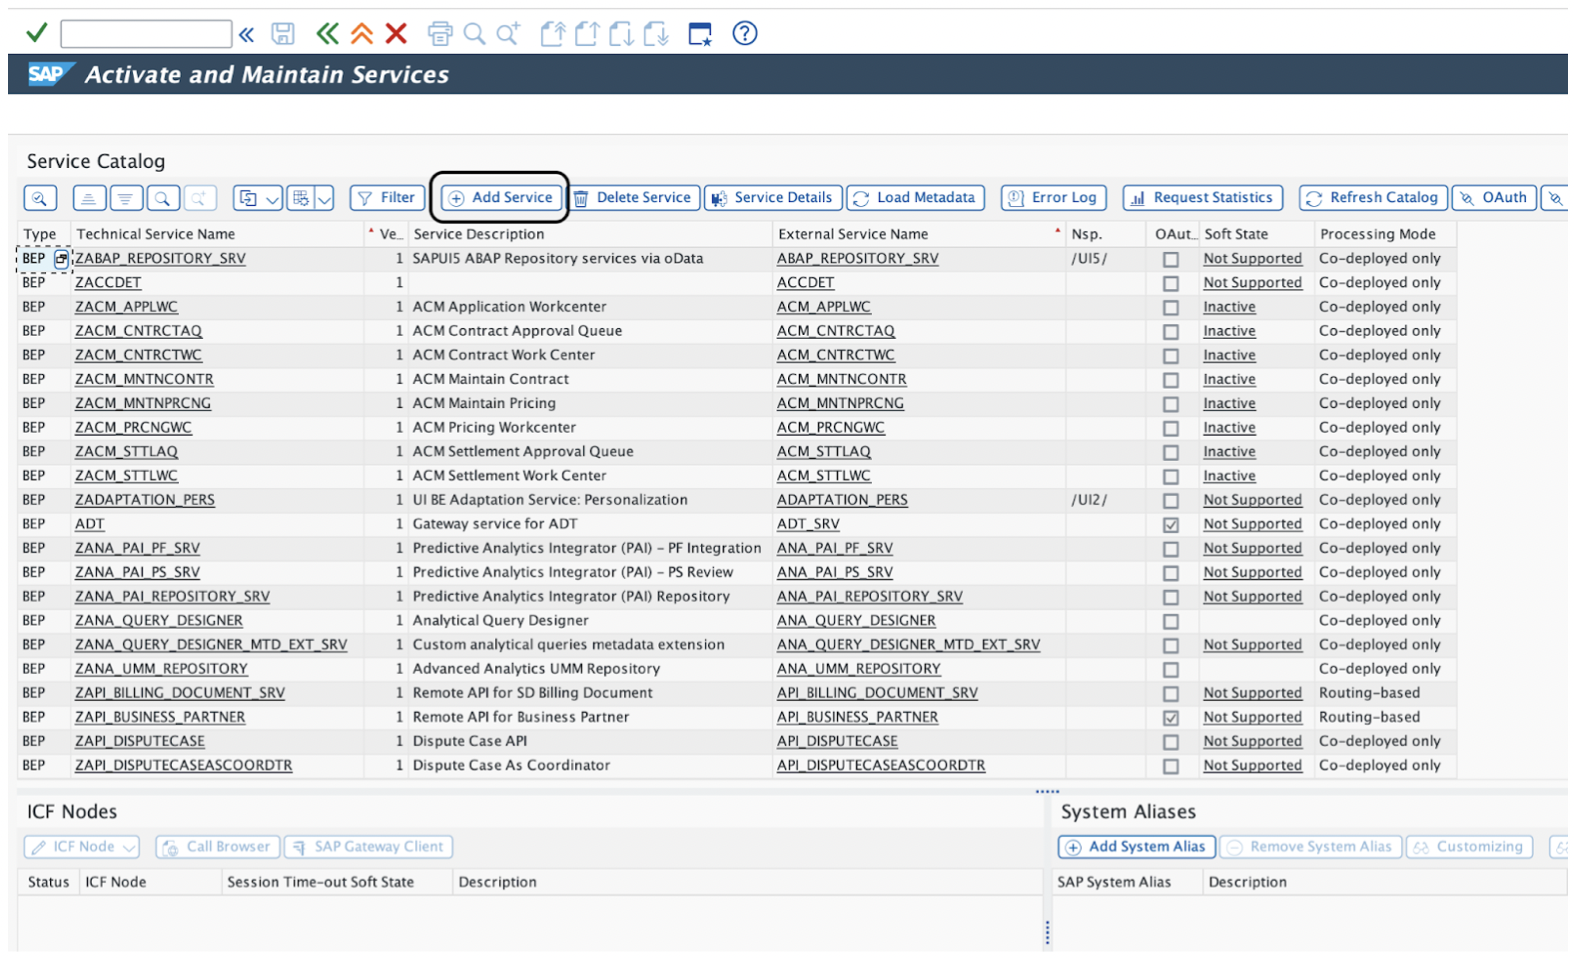
3. Now, open the SAP logon system and go to T-Code “/N/IWFND/MAINT_SERVICE”
4. Click on “Add Service” and find the CDS View Service here which we just created.
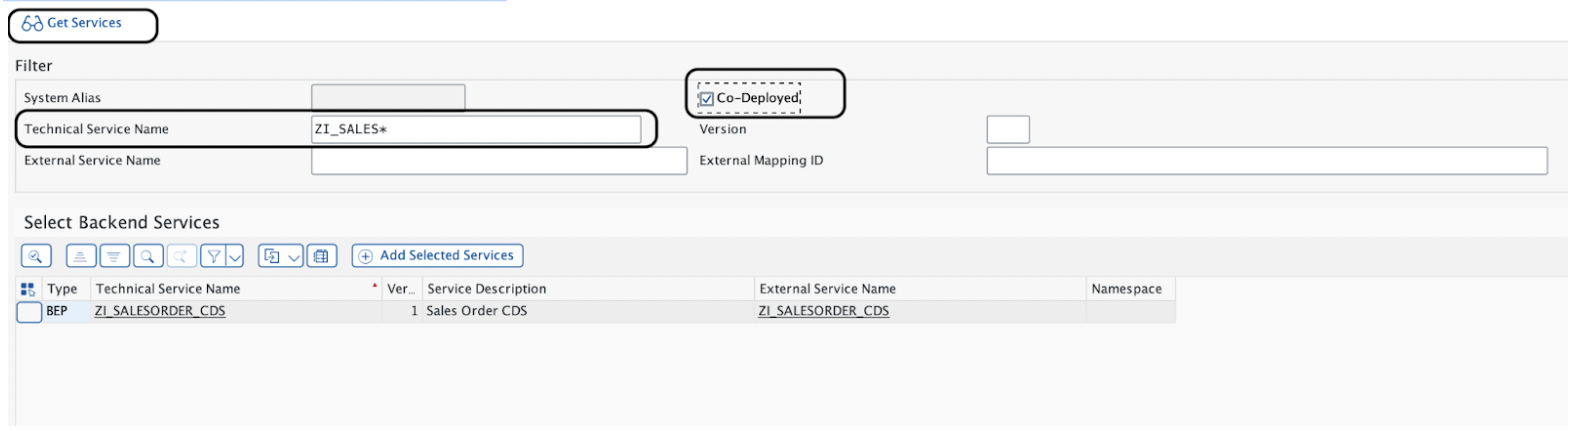
5. Tick the ‘Co-Deployed’ checkbox and enter the service initials and Click on ‘Get Services’. We will be able to see the CDS view name which we created ending with ..CDS. Select and click on ‘Add Selected Services’.
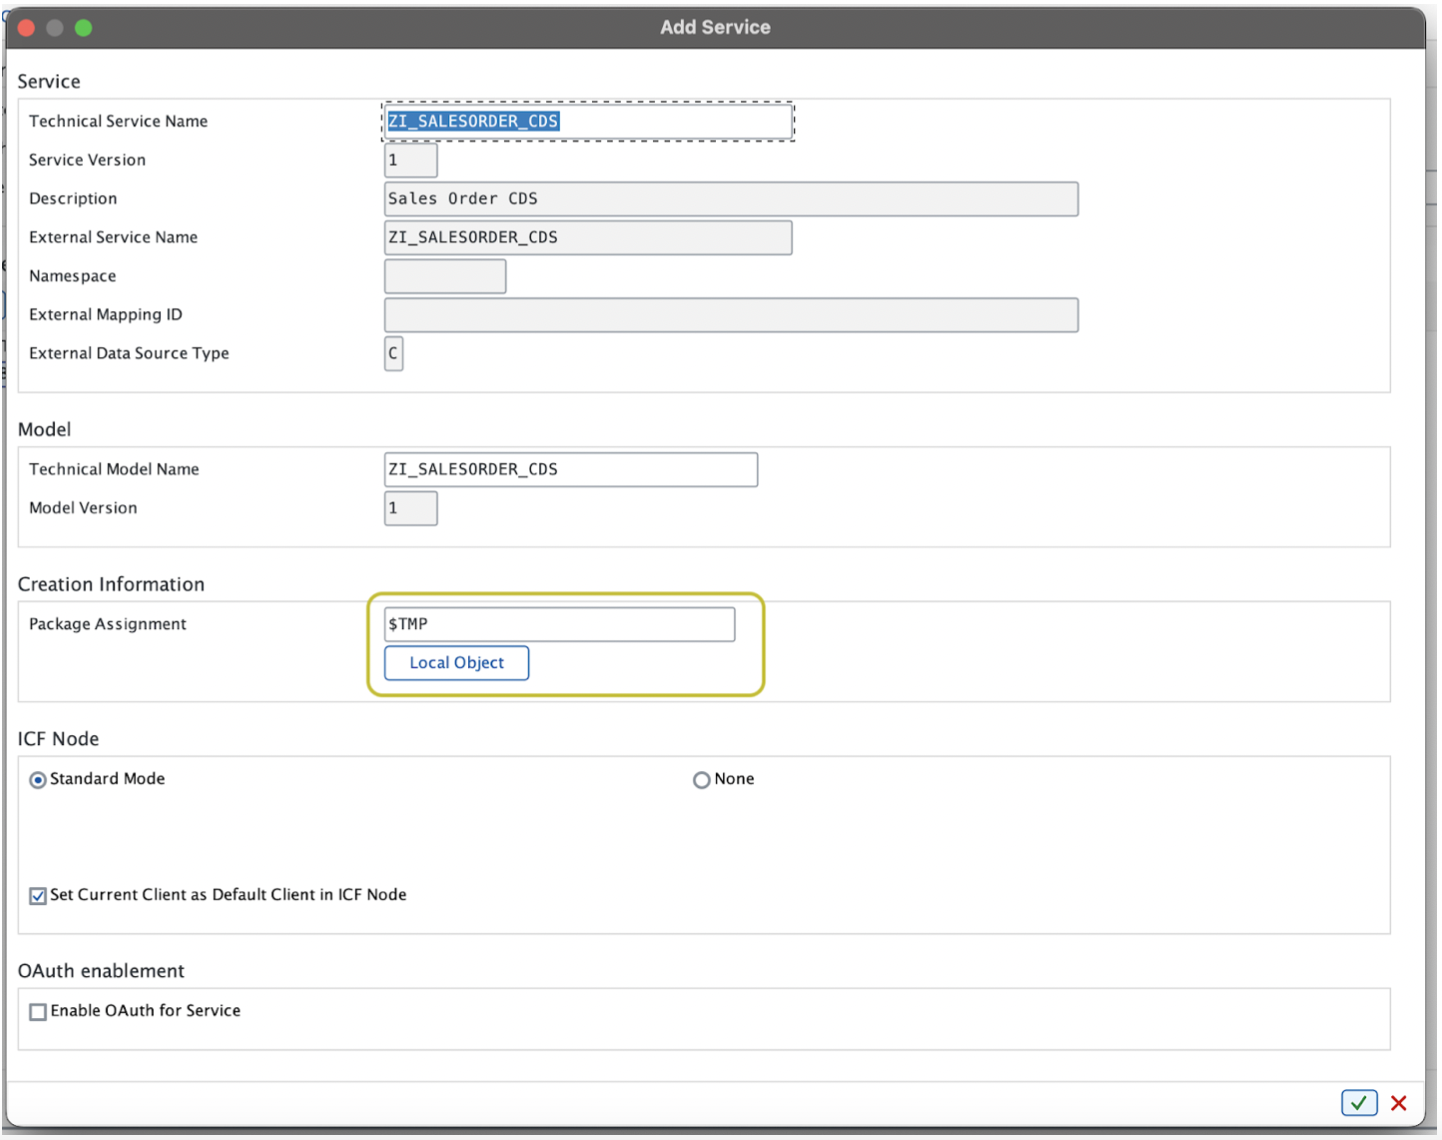
6. A new dialog will open, select ‘Local Object’ and proceed further’.
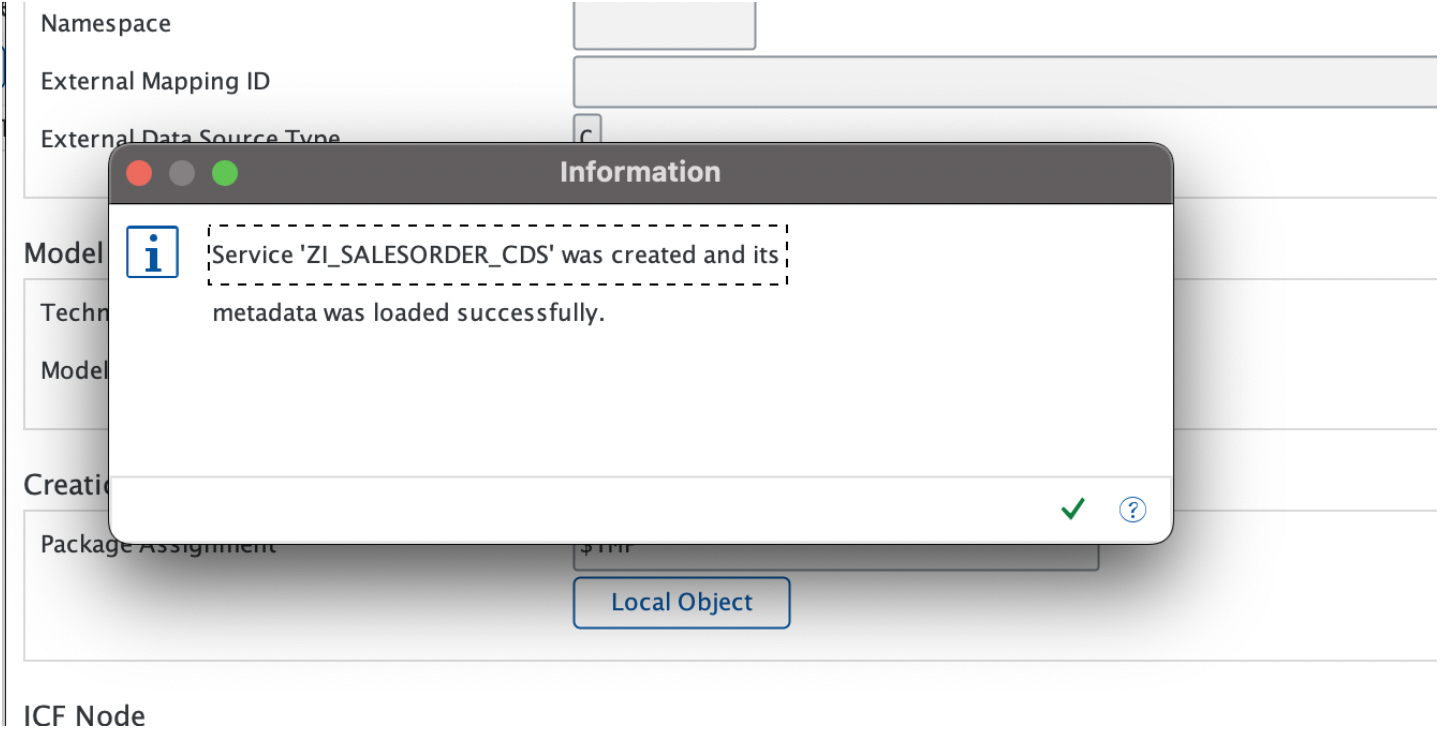
7. After this step, we will see the below message. It means our OData Service ‘ZI_SALESORDER_CDS’ is created and active now.
Creating an Analytical List Page using SAP BAS:
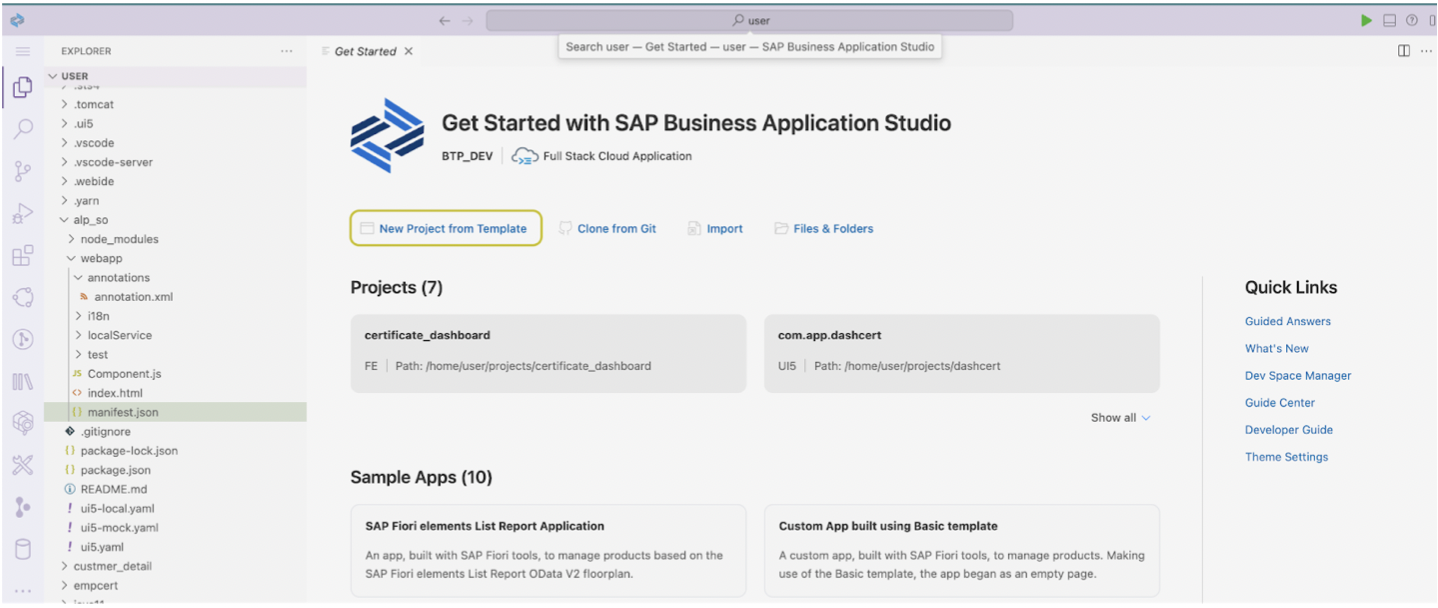
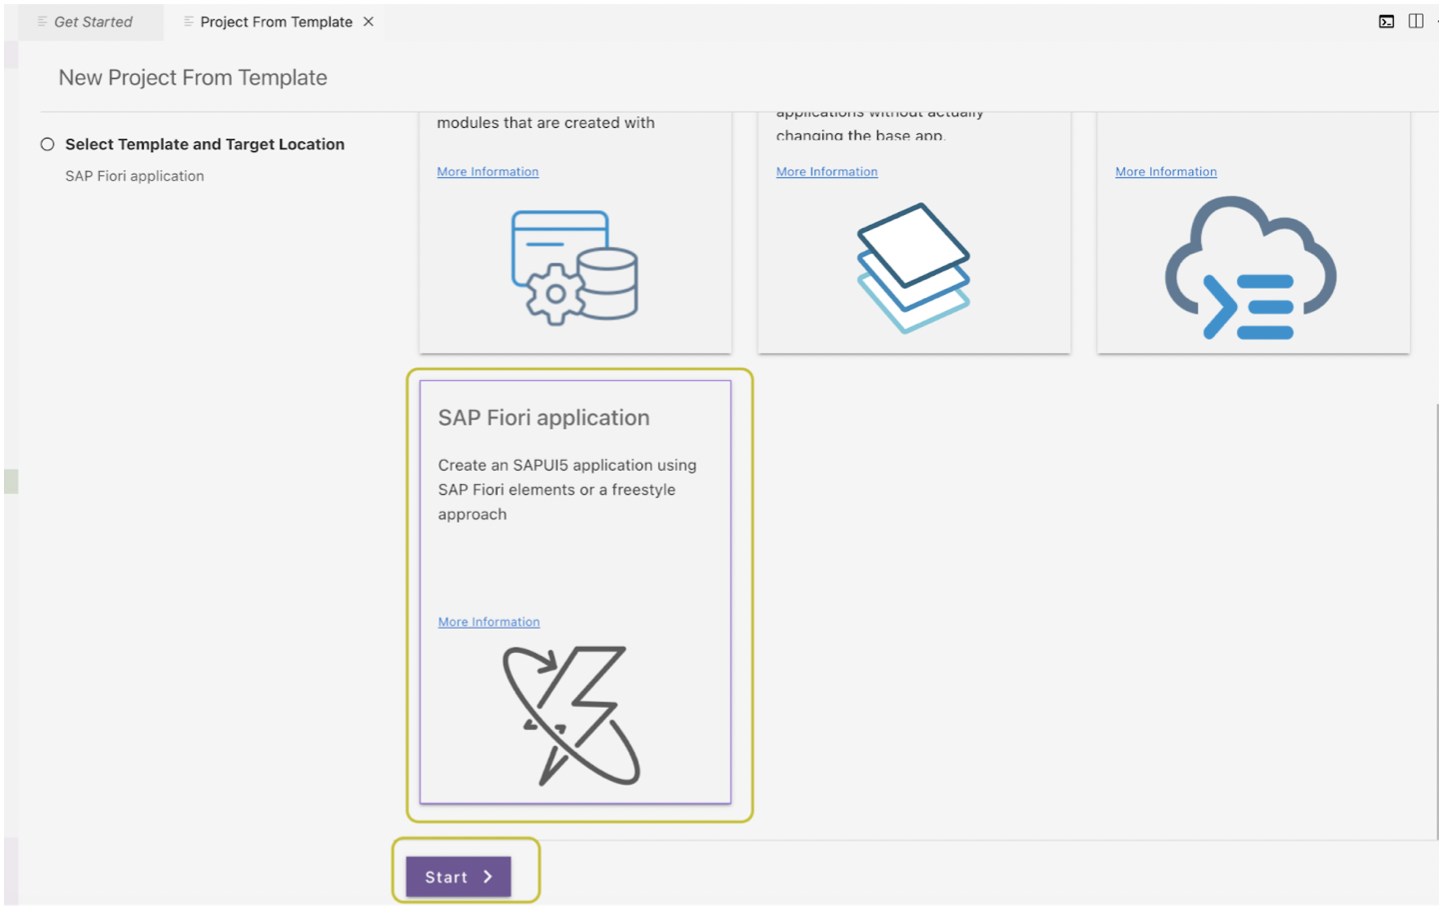
- Open SAP BAS – Dev Space and Select ‘New Project from Template’ > Select ‘SAP Fiori application’ card > click on ‘Start’.
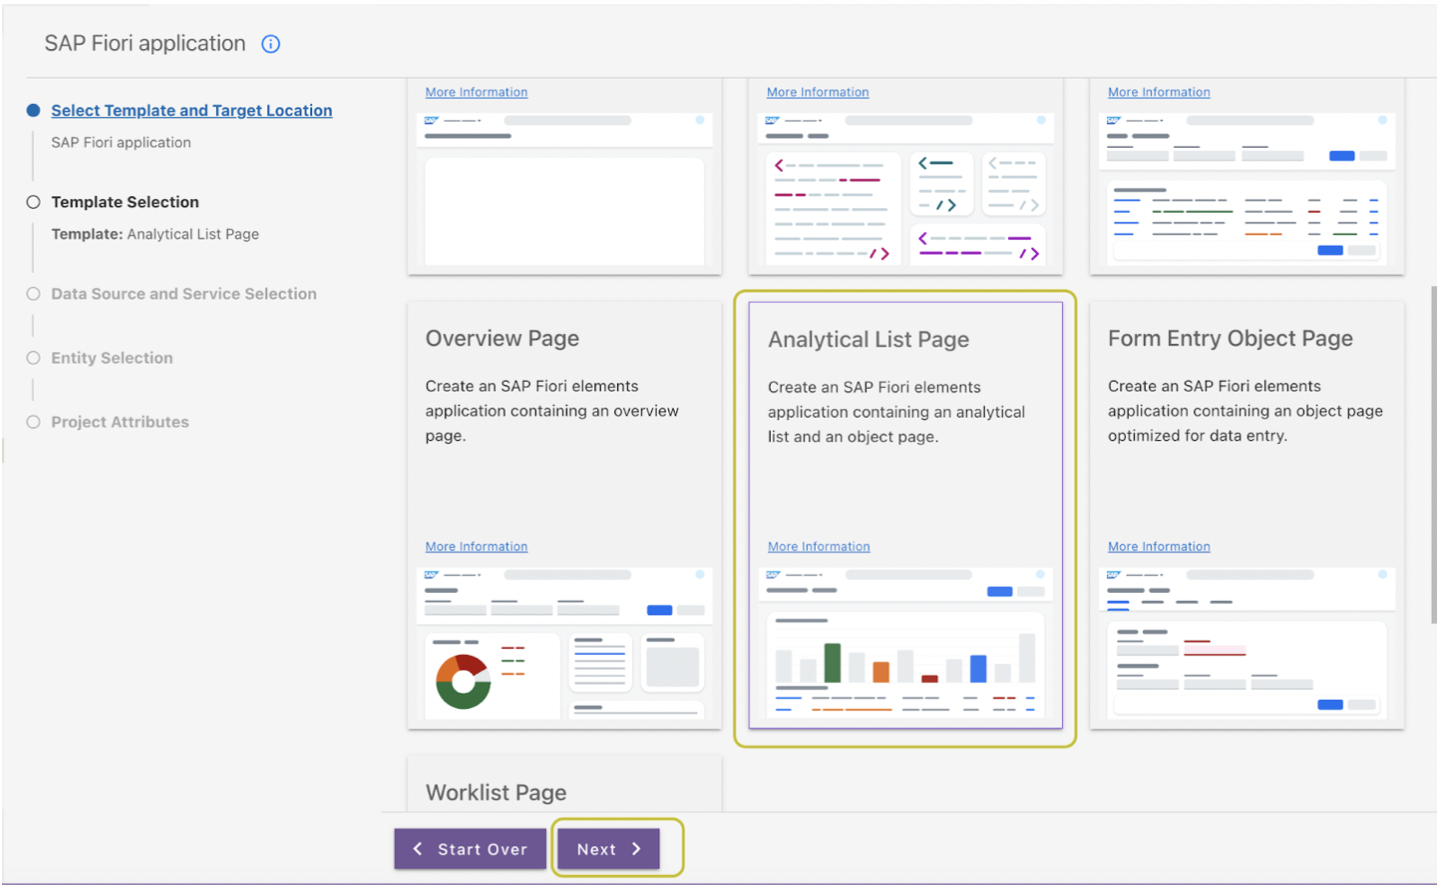
2. Select the ‘Analytical List Page’ template and Click on Next.
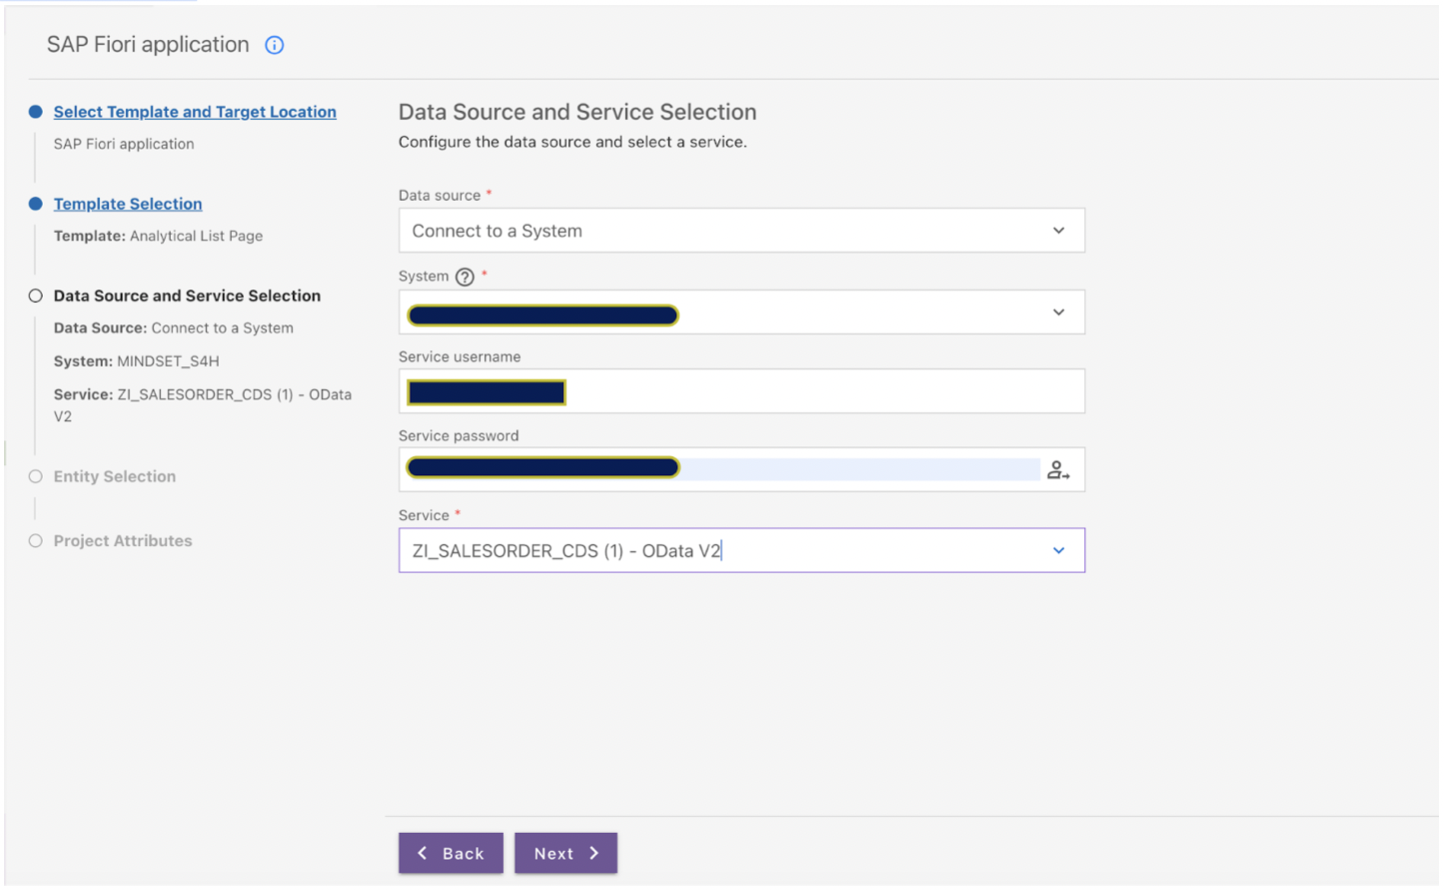
3. In the next page, we will configure Data Source and select the service which we registered above. Click on ‘Next’.
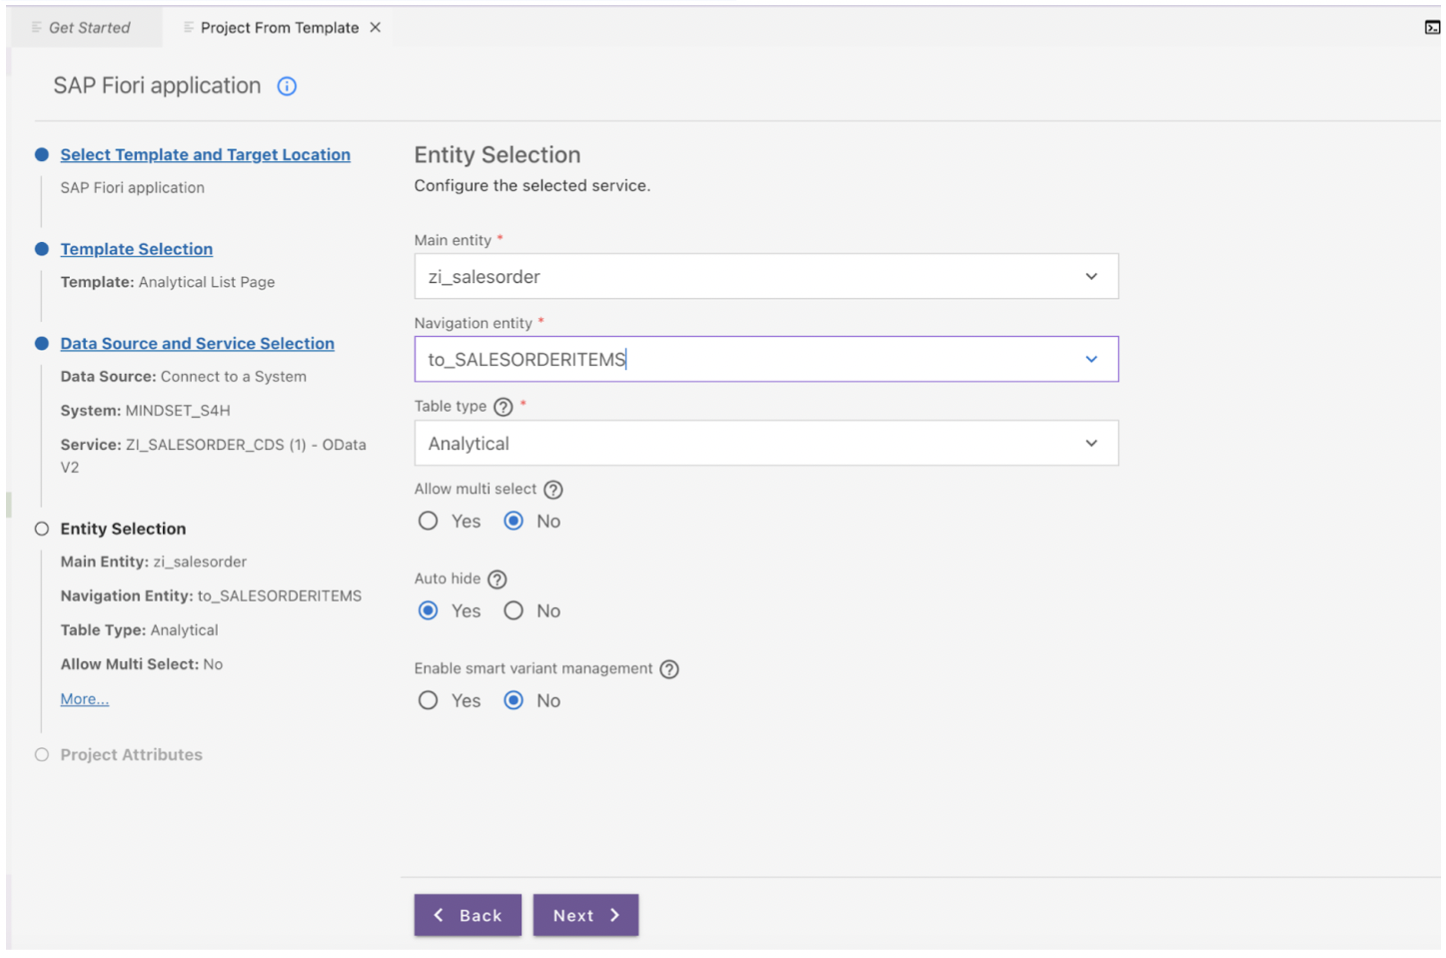
4. Next we will select the entity set as below and click on Next.
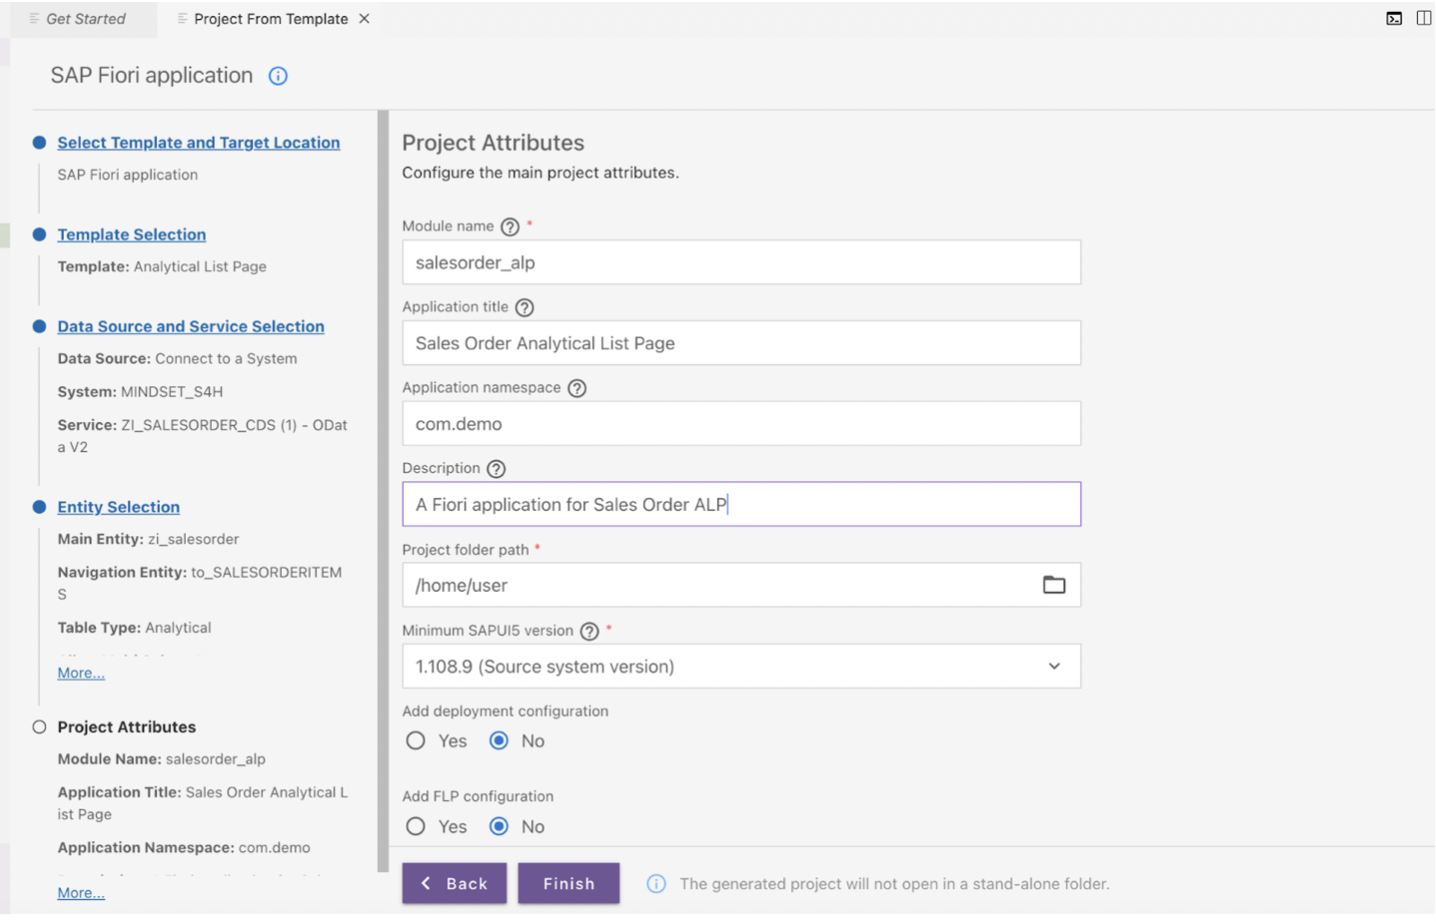
5. Now, provide the below ‘Project attributes’ for the application and click on ‘Finish’.
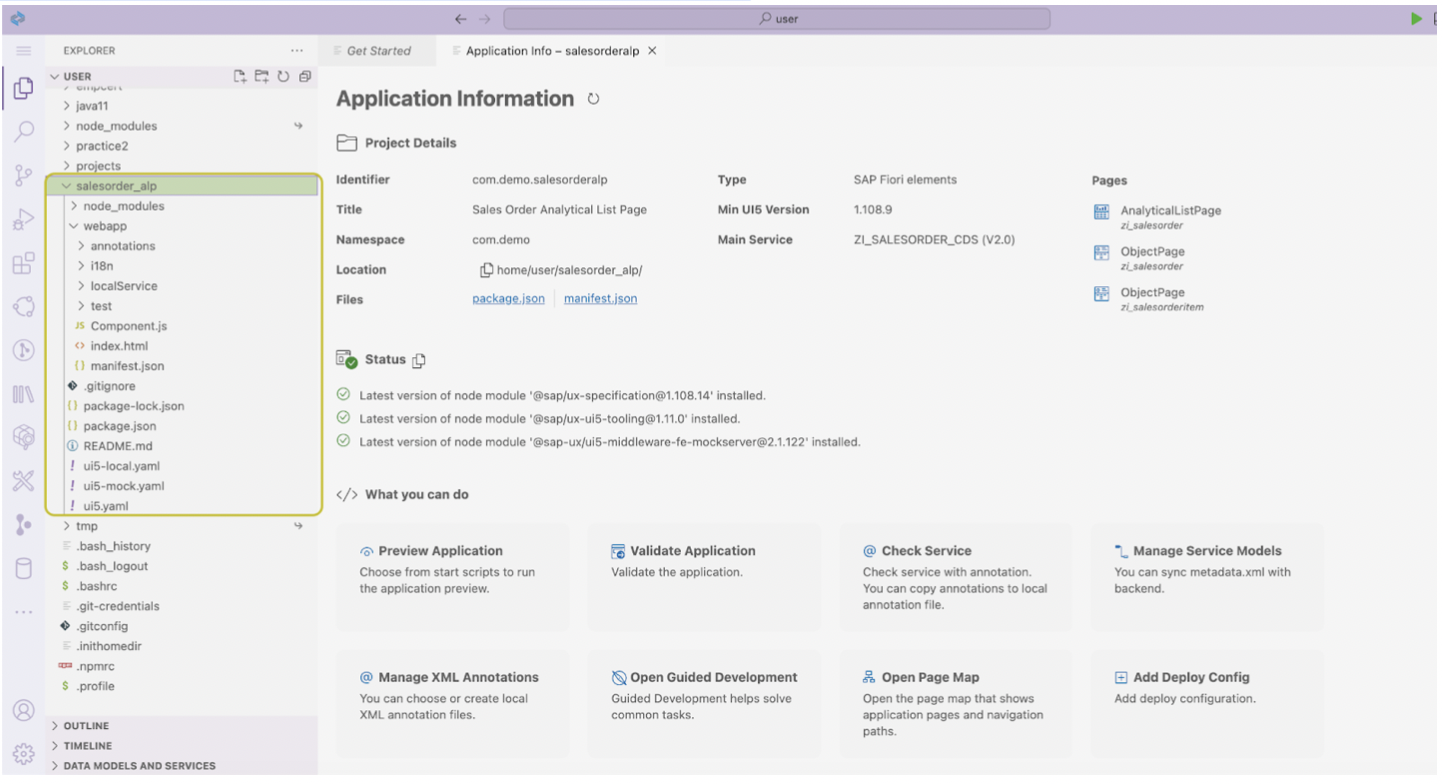
6. Here is the application generated with all the information.
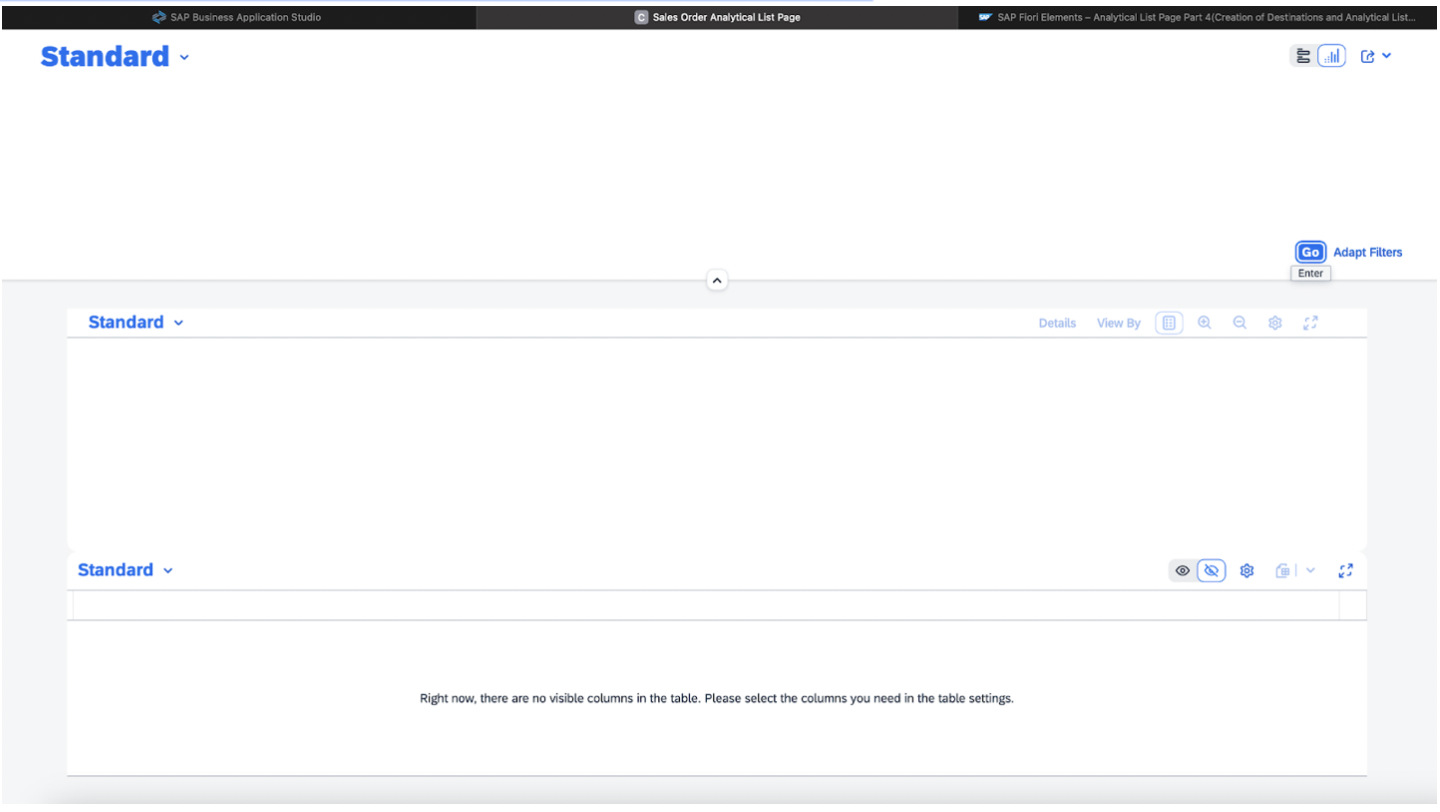
7. Preview the application > Right click on the application’s ‘webapp’ folder and select ‘Preview Application’. The application will look like below since we don’t have any annotations for the table, filters, and charts. We will add annotations in the following steps.
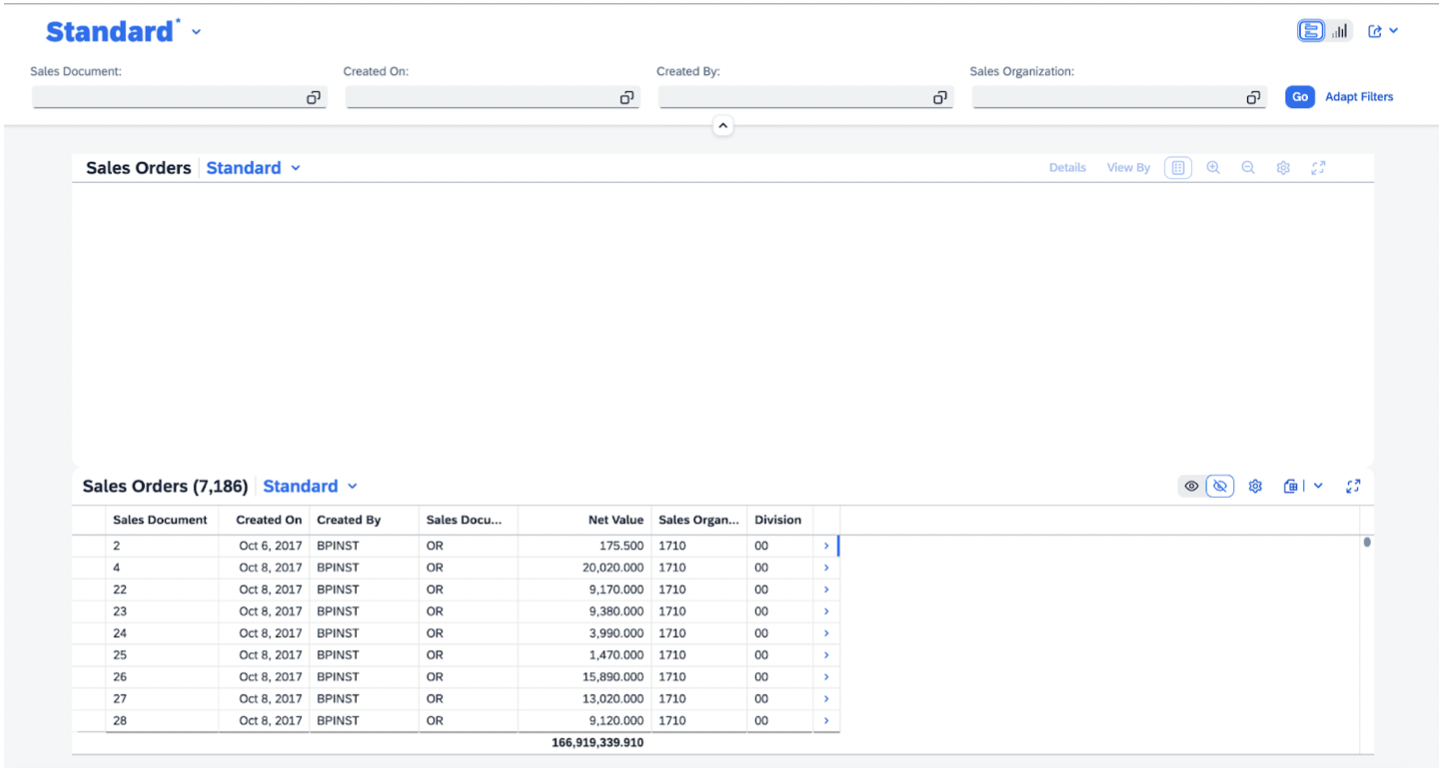
8. After this, we will add some UI annotations in order to load the filters and the table by default like @UI.selectionField, @UI.lineItem etc. as below and re-run the Fiori app.
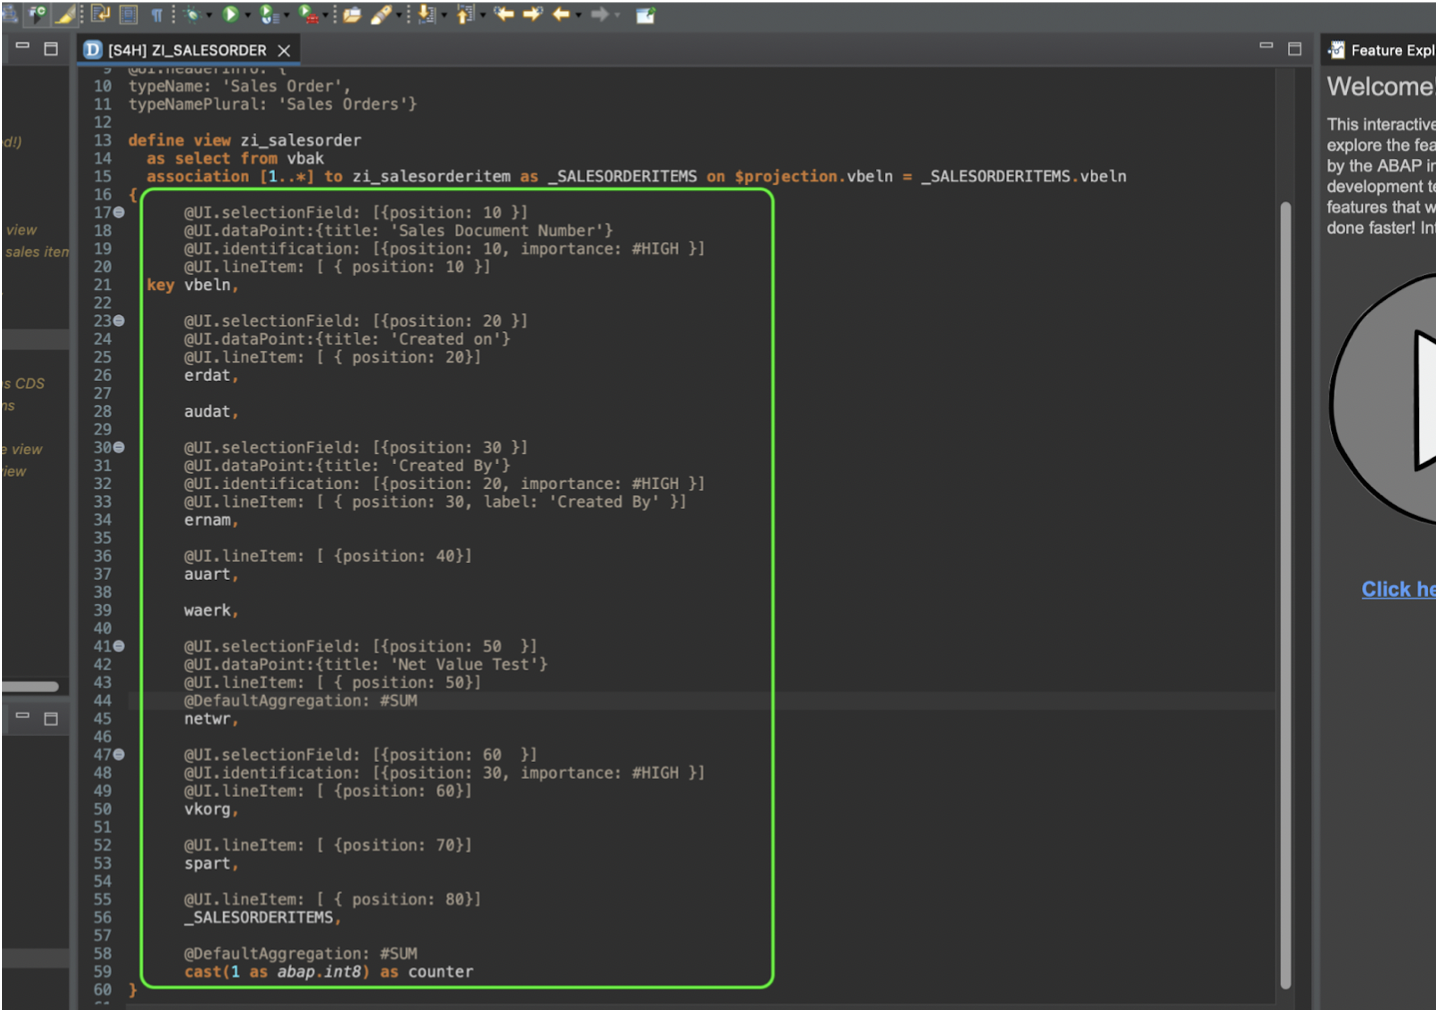
The screen will look like this:
9. Now, write some annotations for adding the charts and graphs to the application.
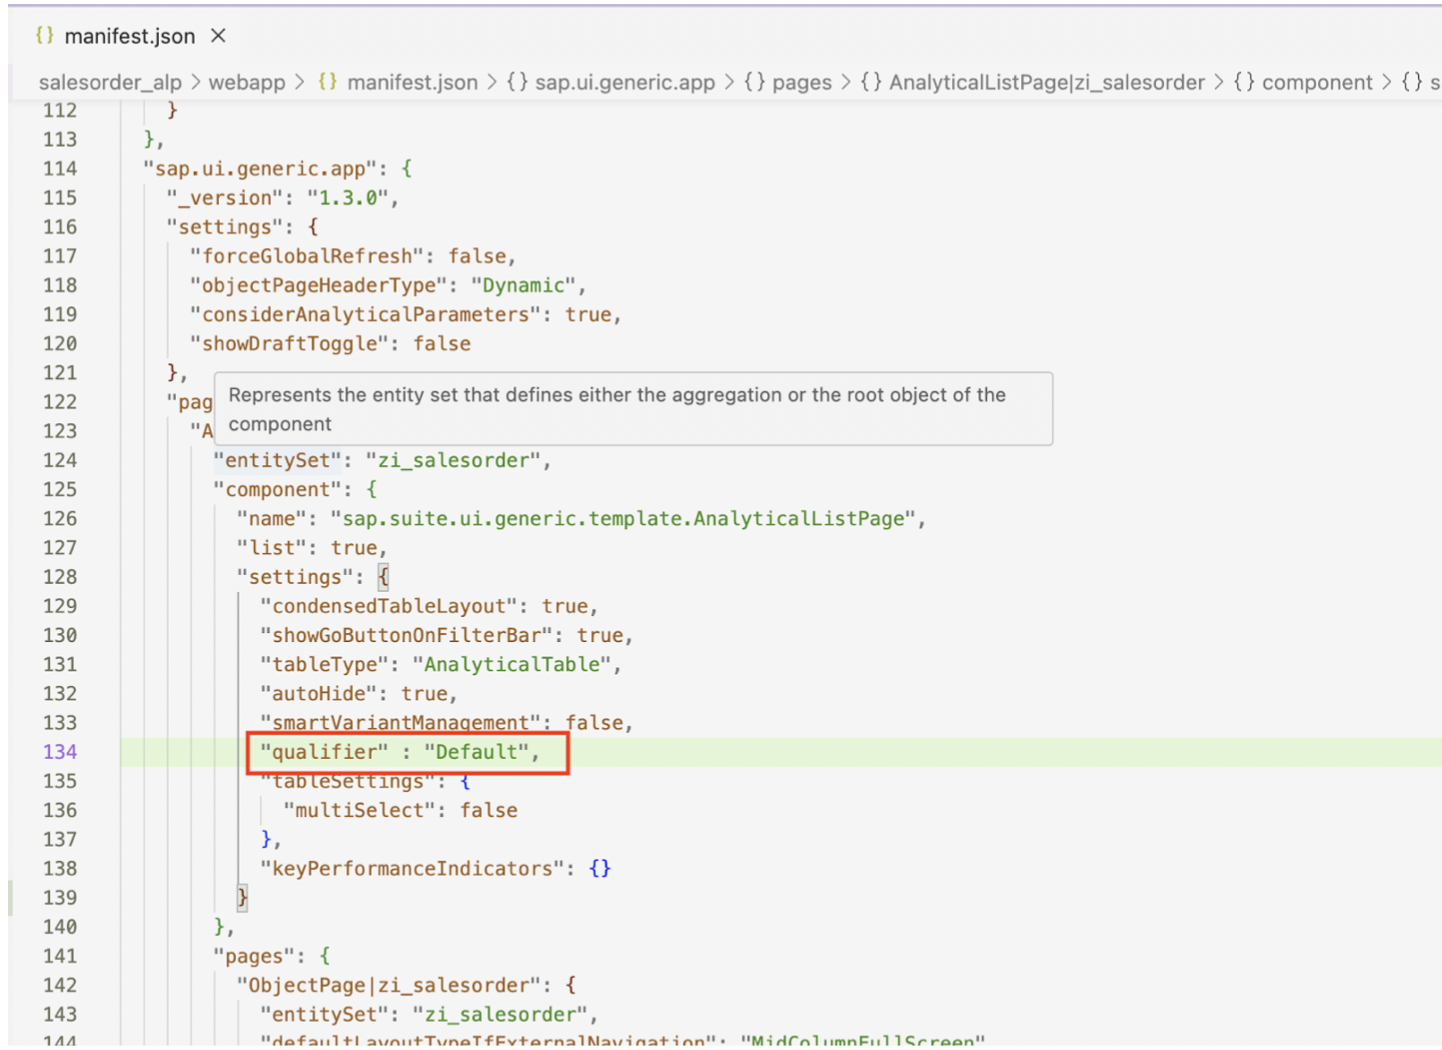
10. Since we have used ‘ChartDefault’ as qualifier in annotation of the Chart, we will add [ “qualifier“ : “Default“ ] in the Manifest’s Analytical List Page Setting.
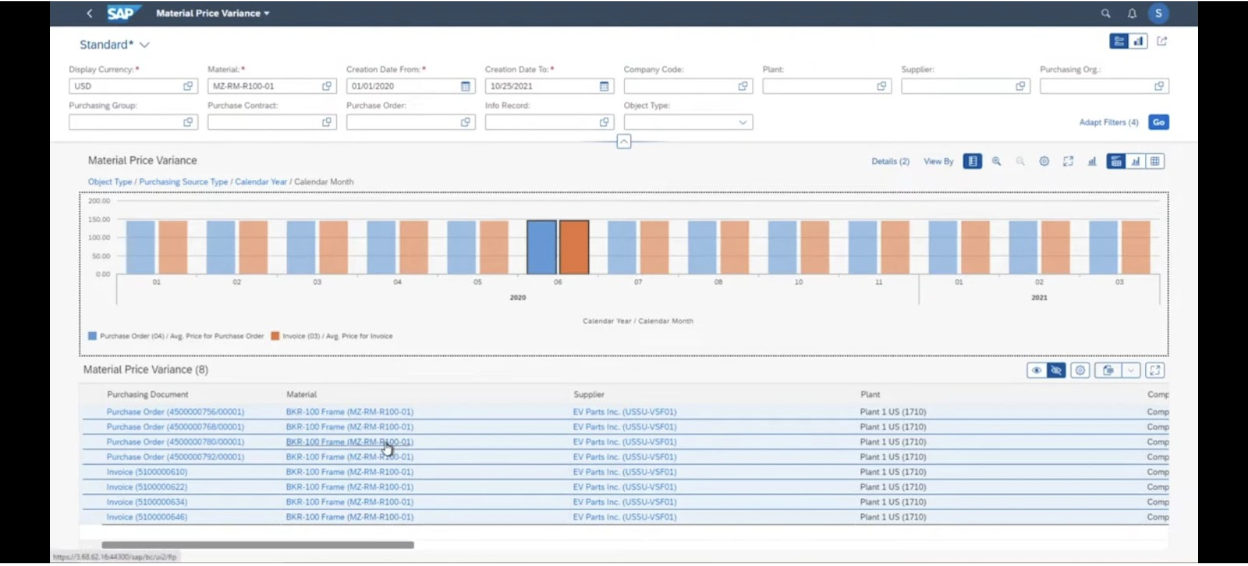
11. Now reload the Fiori application. We can switch the chart type with the help of the highlighted button below.
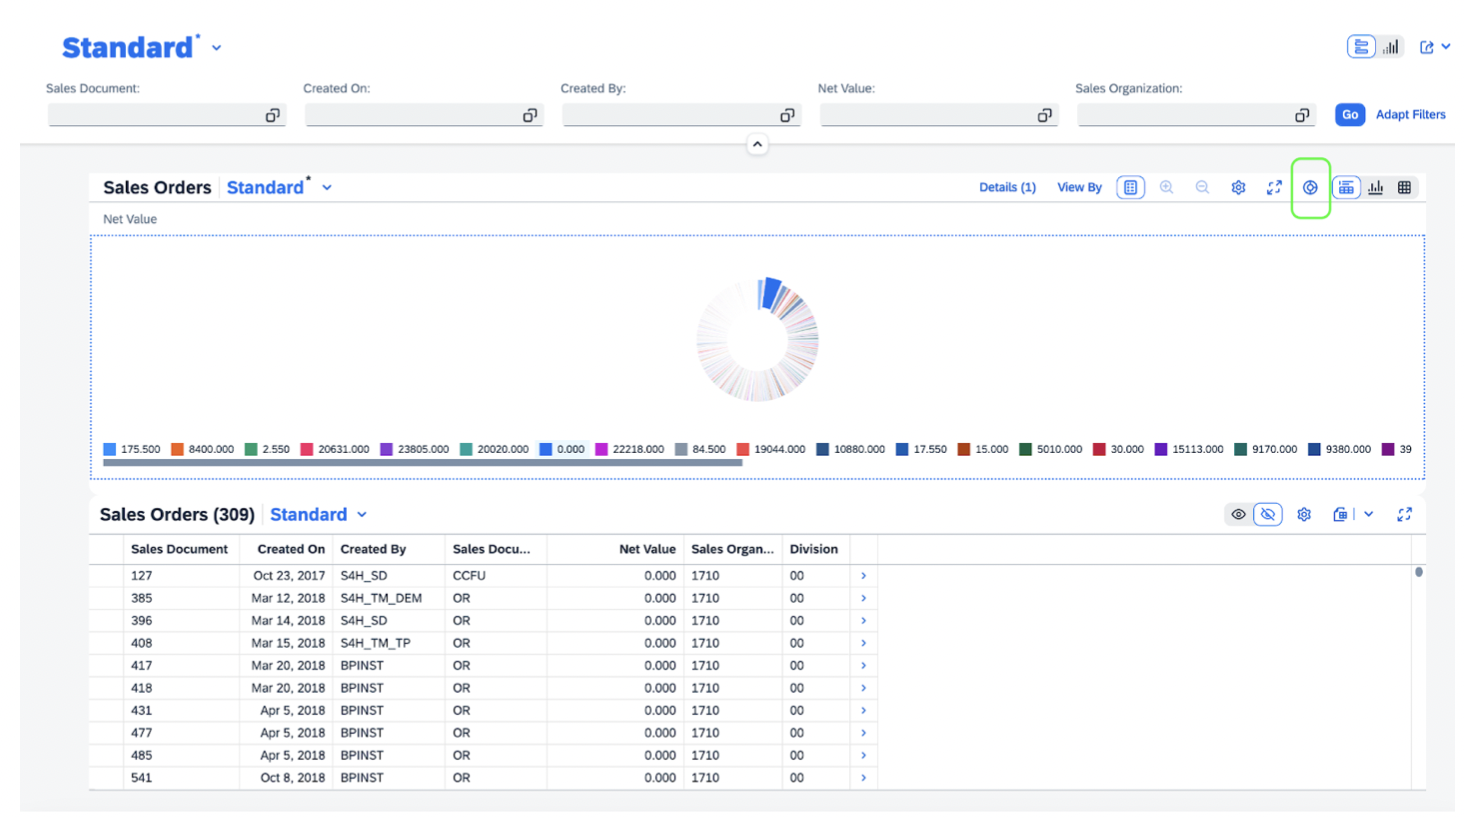
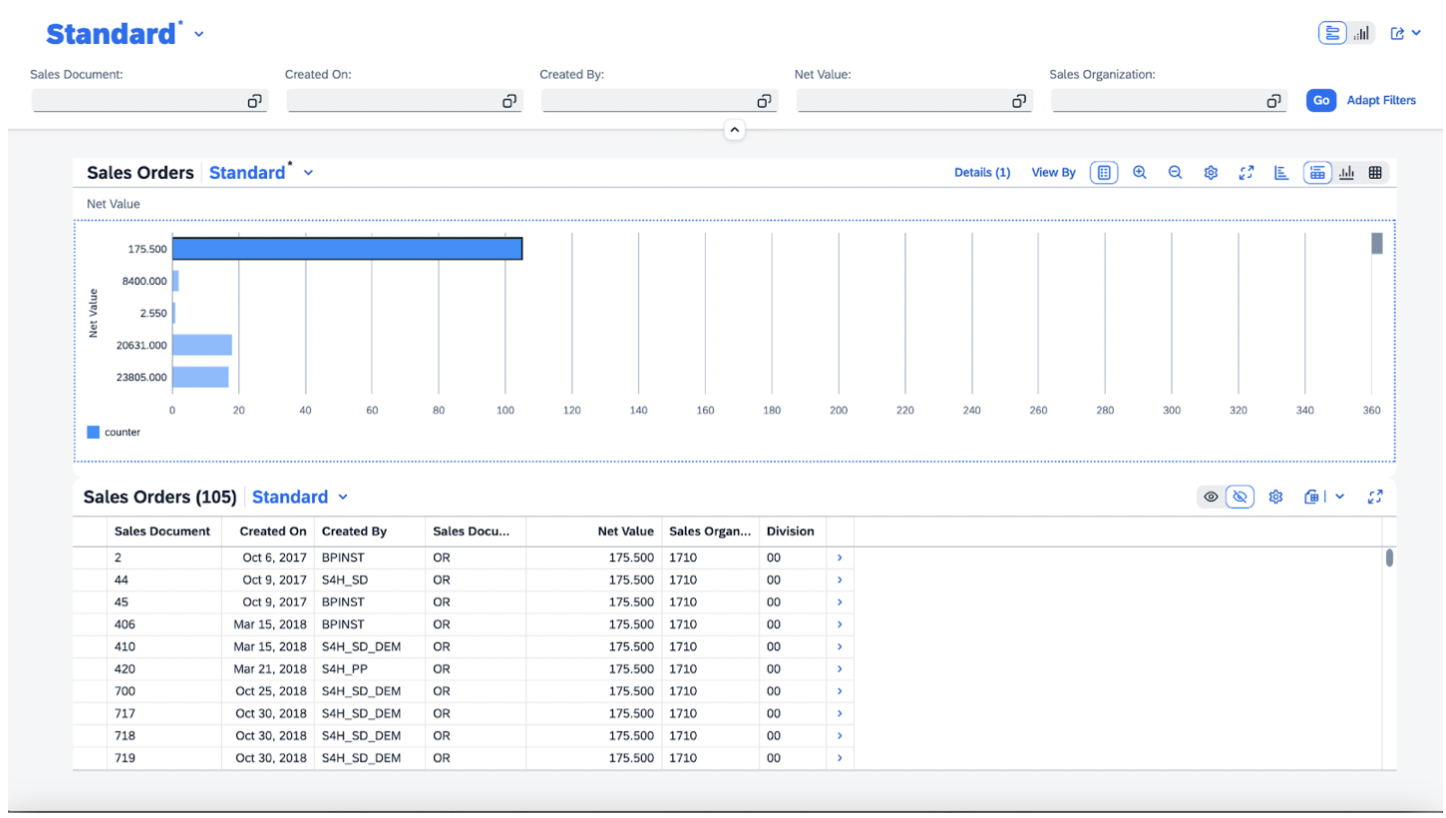
This is how the basic Analytical List Page looks. And this is how we create a basic ALP.
In conclusion, we have successfully built a basic Analytical List Page in this blog. I hope this helps you create an SAP Fiori Element ALP. Happy Learning!